
Many traders place their stop on the other side of a support (for a buy) and aim for the next resistance. The support/resistance method automates this habit: it reads the zones detected on the chart and derives the stop and the two targets from them.
How the levels are calculated
The zones come from the support/resistance indicator: confirmed highs and lows (3 candles on each side by default) are grouped when they are within 0.15% of each other, and a zone is kept only with at least 2 touches. At most 4 zones are kept: the 2 resistances and the 2 supports closest to the last price. Each zone has a lower edge and an upper edge. The entry price is the close of the signal candle.
- Stop of a buy: the nearest support under entry (upper edge below entry); stop = its lower edge − 0.5 ATR (cdBuf setting). For a sell: the nearest resistance, upper edge + 0.5 ATR.
- TP1: the nearest edge of the opposite zone (lower edge of the resistance for a buy).
- TP2: TP1 extended by the entry-to-TP1 distance multiplied by tp2Ext (1 by default).
- Fallback: with no support (resistance) found, the stop is at 1.5 ATR (slMult); with no opposite zone, TP1 is 1.5 ATR from entry.
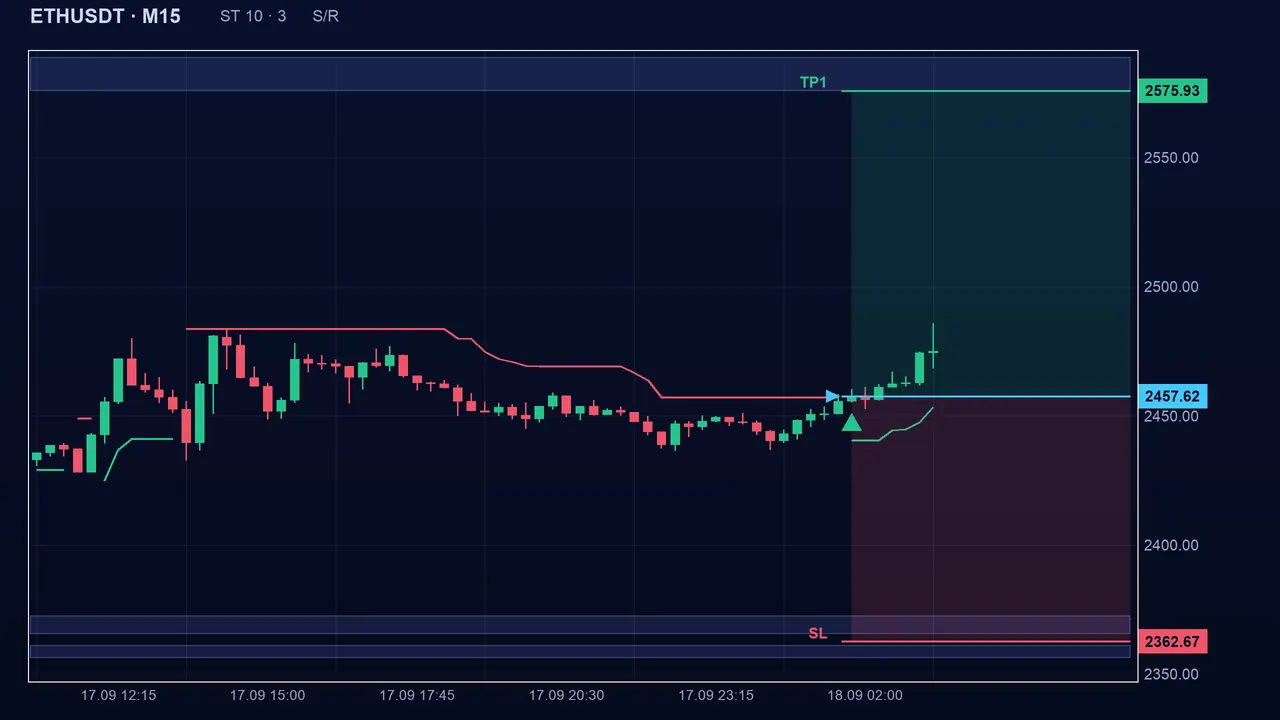
A worked case
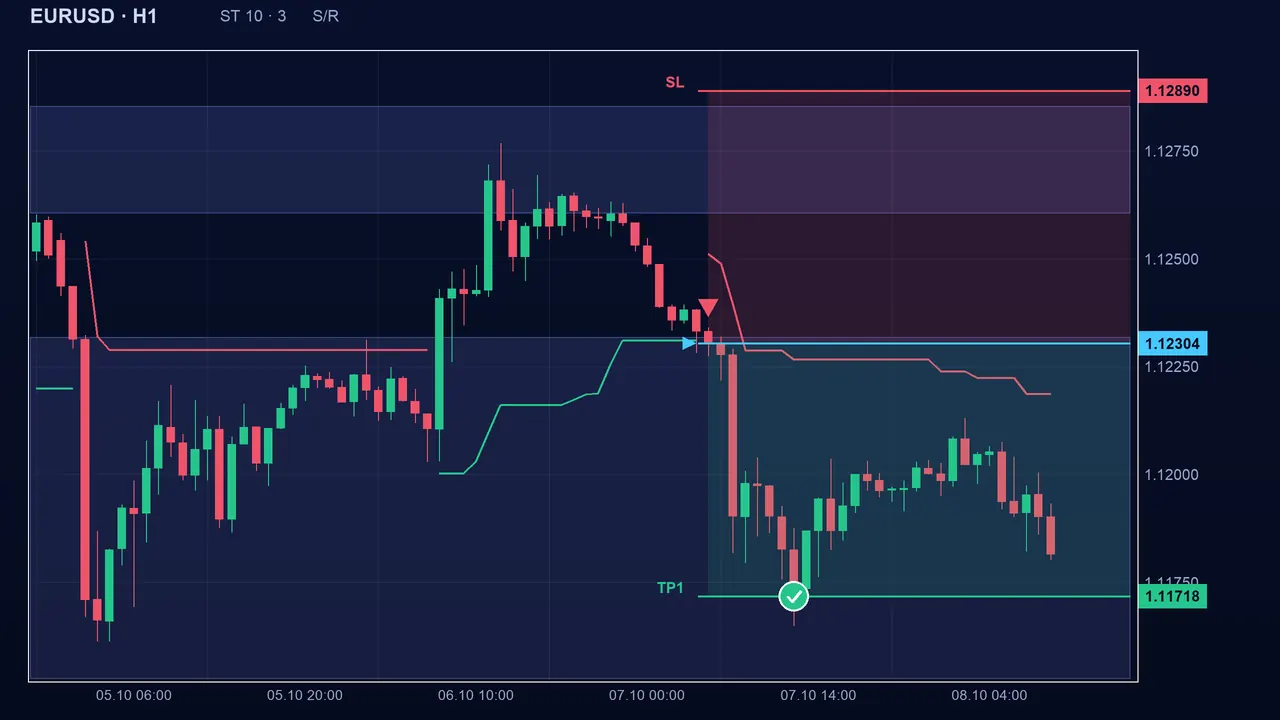
The stop is consistent with how the chart reads: if the support gives way, the idea behind the buy is contradicted. But the distance depends on the zone: here 35 pips, i.e. 3.5 ATR, because the zone is fairly far from entry.
Settings and safeguards
- Margin (cdBuf): 0.5 ATR by default, from 0 to 5. It moves the stop away from the zone’s edge.
- Fallback stop (slMult): 1.5 ATR by default, from 0.1 to 10, also used for the fallback TP1.
- TP2 extension (tp2Ext): 1 by default, from 0.2 to 5. With tp2Ext = 2 on the example, TP2 becomes 1.1020.
- The zones themselves (support/resistance indicator): 3 candles left and right, tolerance 0.0015 (0.15%), 2 touches minimum, 4 zones maximum.
The method is “guarded”: the stop must be on the losing side more than 0.1 ATR away; a stop cap in ATR (maxSlAtr, 0 = unlimited by default); TP1 at least 1 times the risk (minRR1); TP2 at least 2 times the risk (minRR2) and 0.5 risk beyond TP1. A TP1 that is too close is moved away (mode 1, default) or the stop is brought closer (mode 2).
The pitfalls
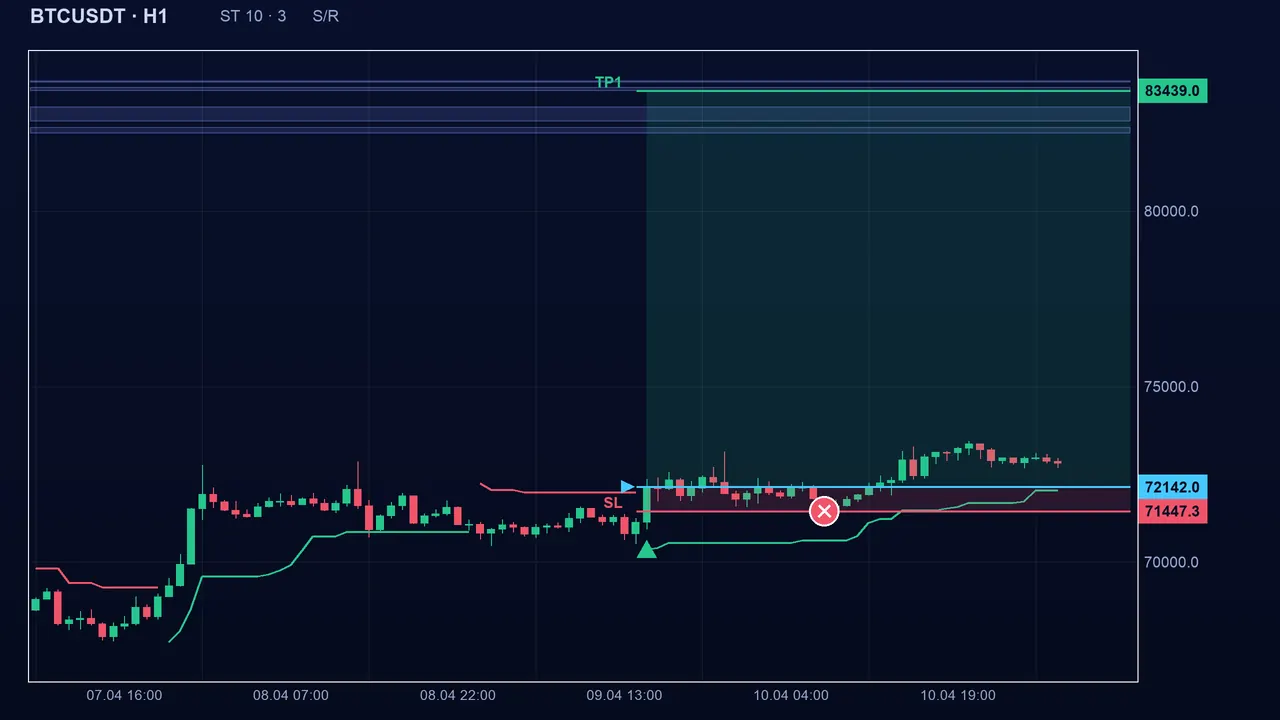
The zones are computed once on the loaded history and relative to the last price: for an old signal they may include points confirmed after it, so read such old levels with caution. A zone can also give way: a much-tested support is not a guarantee of a bounce.
Key takeaways
- Stop under the lower edge of the nearest support (minus 0.5 ATR); TP1 at the lower edge of the resistance; TP2 extends the distance.
- The stop follows a readable level, but its distance can be large: adapt your position size.
- If an opposite zone is too close, the safeguard moves TP1 beyond it.
- With no detected zone, the method falls back to 1.5 ATR.
- Confluence: a buy signal landing on a support (support/resistance indicator) makes this stop more coherent.
📝 Lesson test
Log in to take this lesson’s test. Once you have passed all the tests, you will receive a certificate in your name.
Log inThese lessons are for understanding and are not investment advice. No method guarantees winning.