What is volume imbalance for?
In a balanced market, buyers and sellers trade about the same amount. When one side clearly dominates several candles in a row, we speak of an imbalance. Some traders see in it the trace of a pressure that may continue. The indicator looks for this repeated imbalance rather than a single isolated candle.
How it is calculated
For each candle, Algo Signals computes the same ratio as the footprint, between −1 (all sellers) and +1 (all buyers). Then it looks at the latest candles.
- With real volume (Binance crypto pairs): ratio = (buy volume − sell volume) / (buy volume + sell volume).
- Without volume (Deriv: synthetics, forex, metals, indices): the data has no volume. The ratio is an estimate: (close − open) / (high − low), the share of the body in the range. On Deriv, three candles with a high ratio therefore simply mean three bullish candles with big bodies, not a real order imbalance.
- Bullish event: the last 3 candles all have a ratio above 0.25. Bearish event: all below −0.25.
- The state is then kept: it stays bullish or bearish until the opposite event.
How to read the signal in Algo Signals
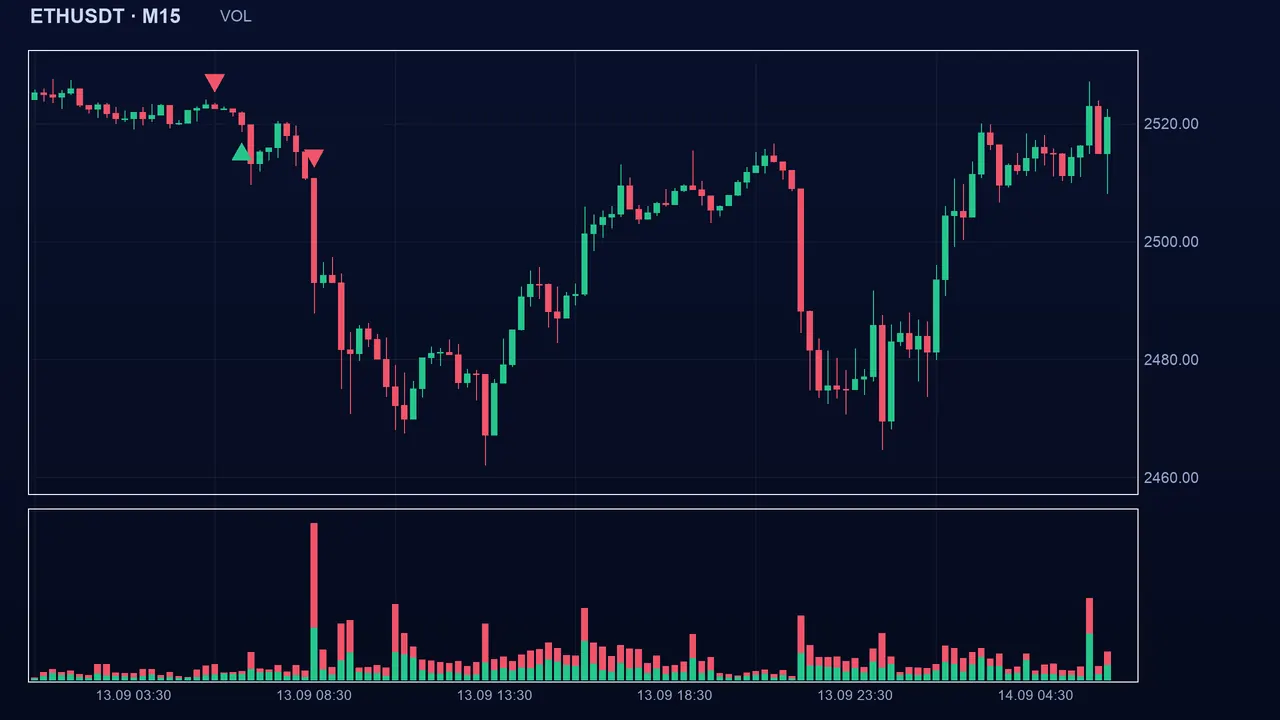
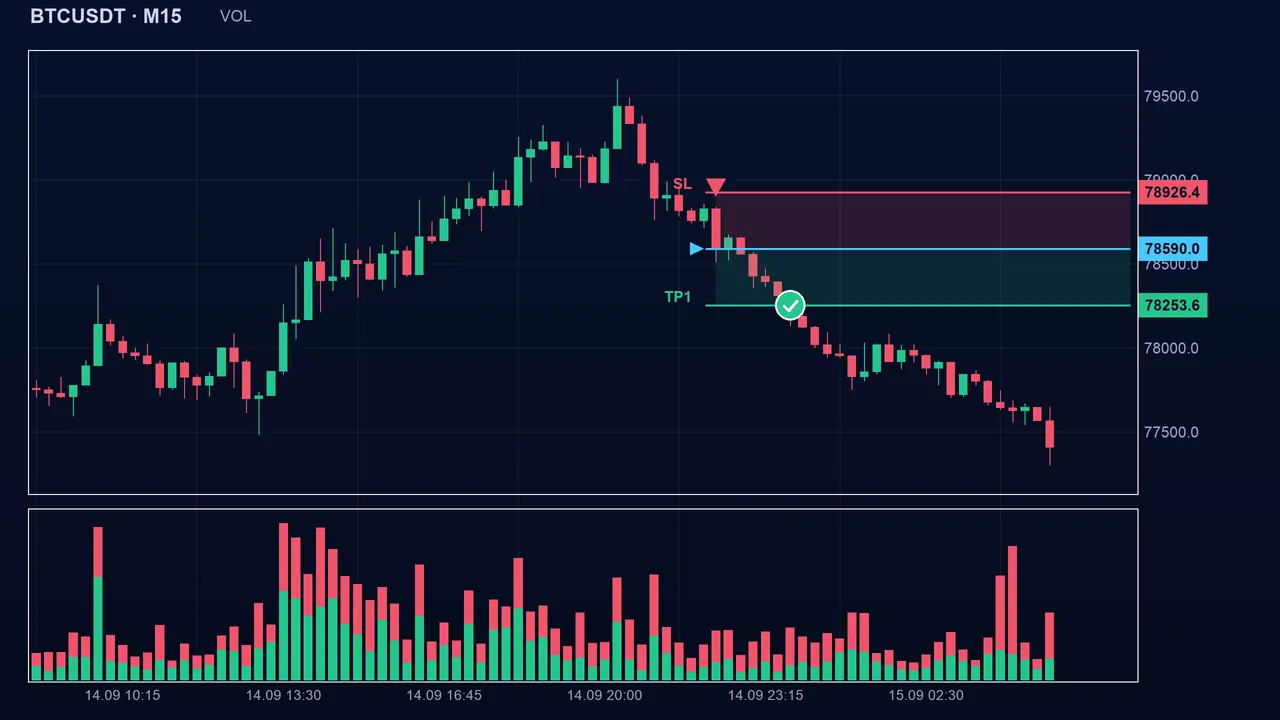
The buy signal appears on the candle that completes the series of 3 bullish imbalances; the sell signal, at the end of a bearish series. If the next candles are weaker, the state does not fade: an opposite series is needed to reverse it. A candle at 0.22 after a series above 0.25 therefore changes nothing.
The settings
- Consecutive candles (imbBars, 3 by default, from 1 to 10): larger, the signal is rarer and later; at 1, a single candle is enough.
- Imbalance threshold (imbThr, 0.25 by default, from 0.01 to 0.95): larger, candles must be strongly dominated by one side; smaller, the signal is more frequent.
The pitfalls
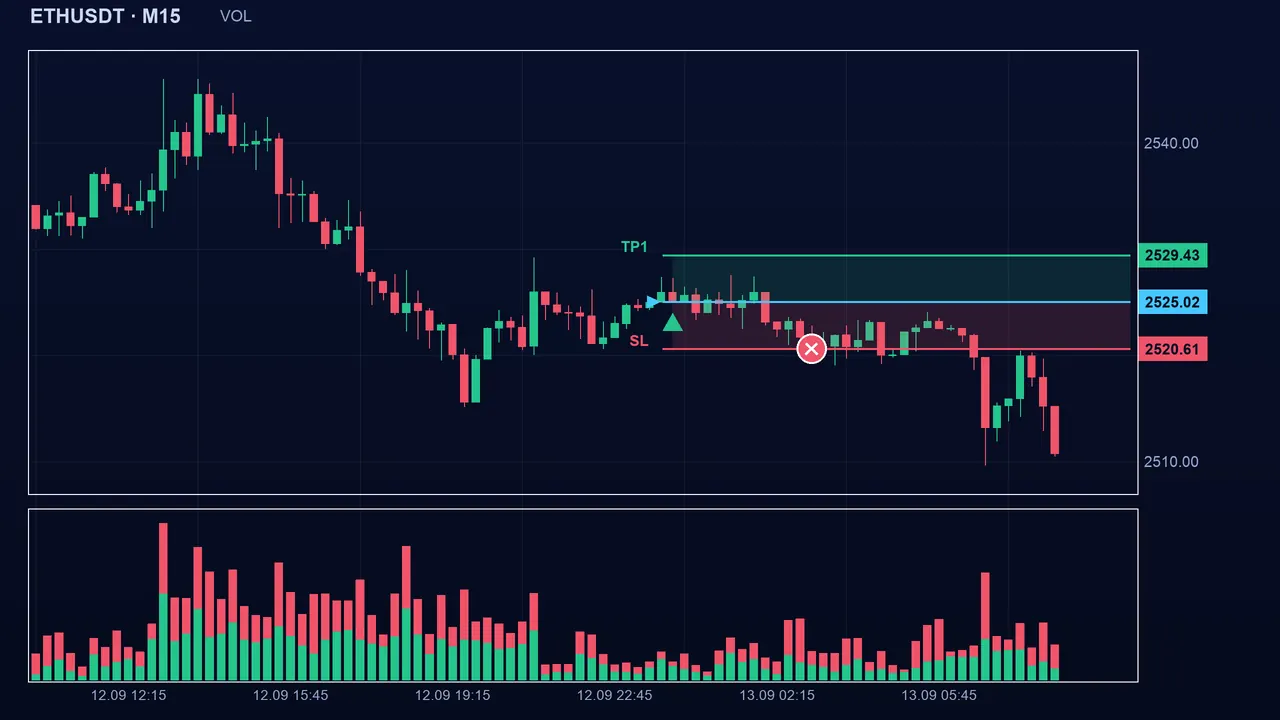
Three candles in a row from the same side often arrive late in a move: the signal can land when most of the rise has already happened. Because the state is kept, it can stay “bullish” long after the pressure has vanished. On Deriv, remember it is only an estimate drawn from the shape of the candles.
Key takeaways
- A series of 3 candles each with a ratio above +0.25 (bullish) or below −0.25 (bearish), the ratio being (buy − sell) / (buy + sell) on Binance.
- On Deriv there is no real volume: the ratio is an estimate based on the candle’s shape.
- The state is kept until the opposite event: it can stay displayed too long.
- Combine it with the footprint, cumulative delta and the trend, and always keep a stop.
📝 Lesson test
Log in to take this lesson’s test. Once you have passed all the tests, you will receive a certificate in your name.
Log inThese lessons are for understanding and are not investment advice. No method guarantees winning.