
Picture a big wave of sellers hitting a price, and the price does not fall. Someone is absorbing all those sales. The Absorption indicator looks for exactly that situation: lots of volume, one side apparently dominating, yet a price that does not give way.
What it is for
Volume alone does not say who is winning. Absorption compares what was bought and sold in a very high-volume candle, then checks whether the candle held. If sellers dominate but price closes without falling, we infer a more patient buyer picked everything up: a buy signal. The reverse gives a sell signal.
How it is calculated
- Flow ratio of a candle = (buy volume − sell volume) ÷ (buy volume + sell volume). It runs from −1 (all sellers) to +1 (all buyers).
- High volume: the candle’s volume must be at least 1.8 times the average of the last 20 candles (the average includes the current candle).
- Buy: ratio below −0.2 (net sellers) AND close greater than or equal to open (price held). Sell: ratio above +0.2 AND close less than or equal to open.
- The state (bullish or bearish) persists until the opposite signal.
On Binance, buy and sell volumes are real. On Deriv there is no real volume: the site uses an estimate (proxy) taken from the candle, with ratio = (close − open) ÷ (high − low) and “volume” = high − low. Consequence: with this estimate, a negative ratio always means a close below the open, so the buy condition is impossible (and so is the sell one). On Deriv, Absorption can never produce a signal. It only makes sense with real volumes.
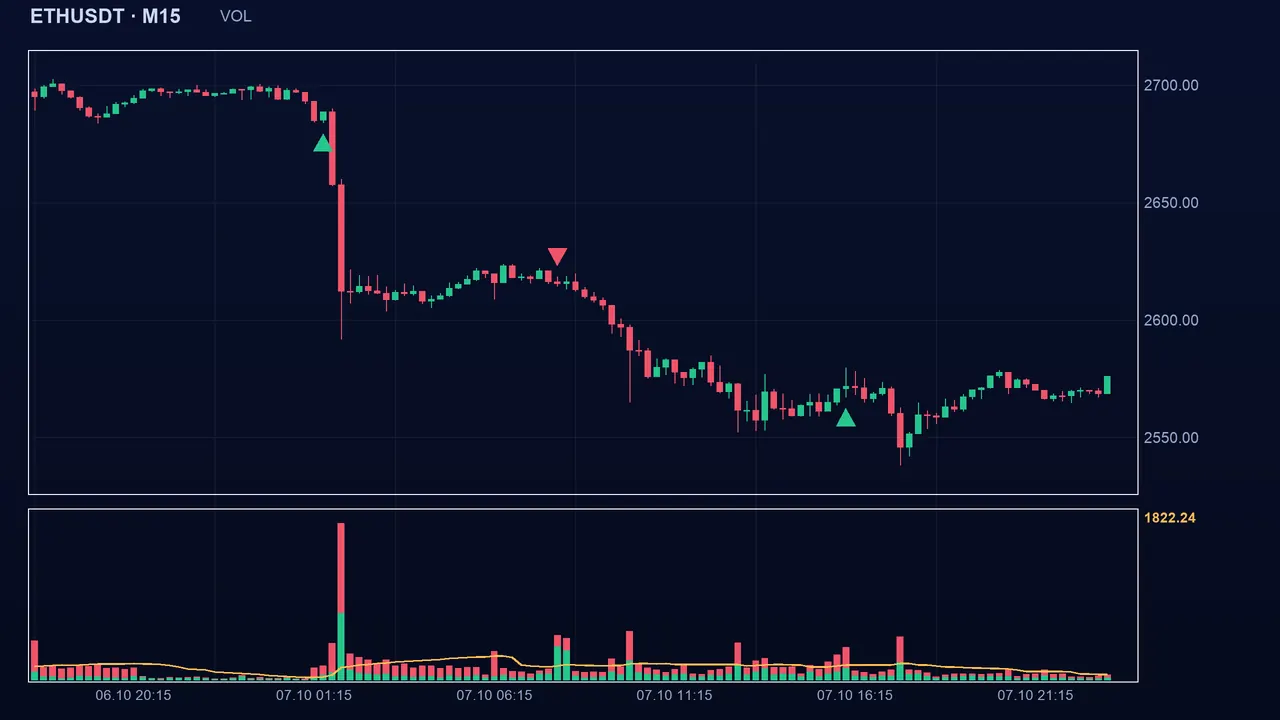
Reading the signal in Algo Signals
An arrow appears on the candle that meets all the conditions, and Algo Signals flags the moment the state flips. It is a rare signal: most candles do not trigger it.
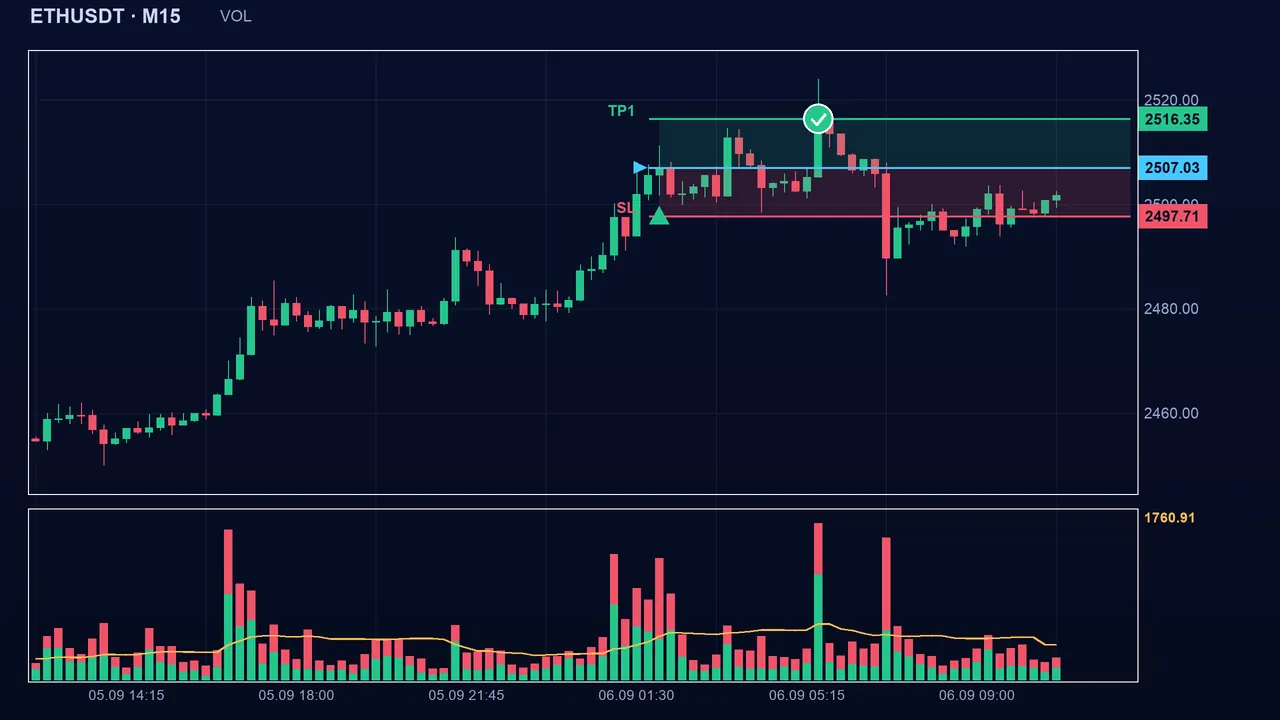
Settings and pitfalls
- Period (20, from 2 to 300): number of candles in the volume average.
- Volume multiplier (1.8, from 1 to 10): the larger it is, the rarer the signals and the bigger the candles involved.
- Absorption threshold (0.2, from 0.01 to 0.95): the larger it is, the clearer the imbalance between buyers and sellers must be.
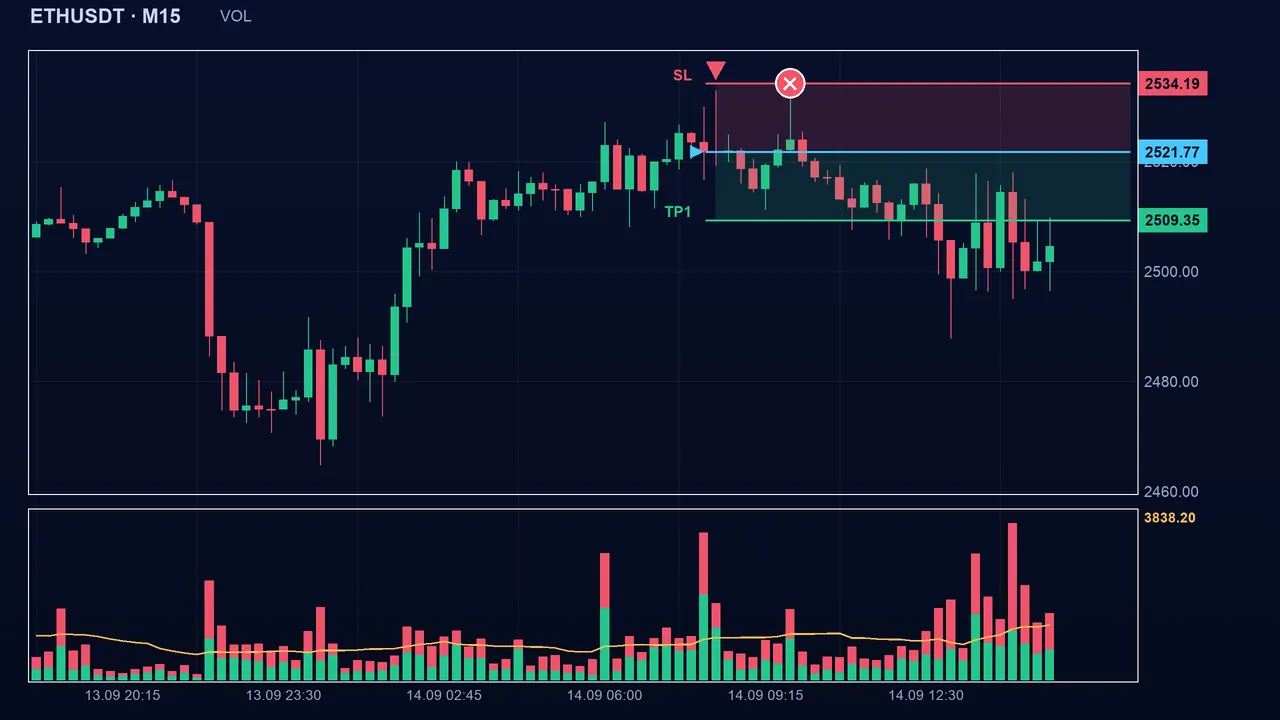
Key takeaways
- Absorption looks for heavy volume (≥ 1.8 × the average) where the dominant side did not move the price.
- Buy: net sellers but close ≥ open. Sell: net buyers but close ≤ open.
- It needs real buy / sell volume (Binance). On Deriv, the estimate makes any signal impossible.
- The signal tells you what happened on one candle, not what comes next.
📝 Lesson test
Log in to take this lesson’s test. Once you have passed all the tests, you will receive a certificate in your name.
Log inThese lessons are for understanding and are not investment advice. No method guarantees winning.