
Some traders believe that after a very sharp pullback, a trending market tends to return toward its average. This is the idea of “mean reversion”. Algo Signals’ short RSI turns it into a rule: an extremely short RSI, which swings fast, combined with a trend average that says which way to play. It is an idea, not a law.
How it is calculated
It is the same calculation as the RSI (Wilder’s average of closing gains and losses, RSI = 100 − 100 ÷ (1 + RS)), but over only 2 candles. With such a short period the RSI jumps from 90 to 5 in a candle or two. In addition, Algo Signals computes a simple moving average of closes over 200 candles, the “trend average”.
- RSI period: 2 by default. It reacts almost every candle.
- Trend average: simple average of the last 200 closes.
- Default levels: 10 (oversold) and 90 (overbought), far more extreme than 30 and 70.
Reading the signal in Algo Signals
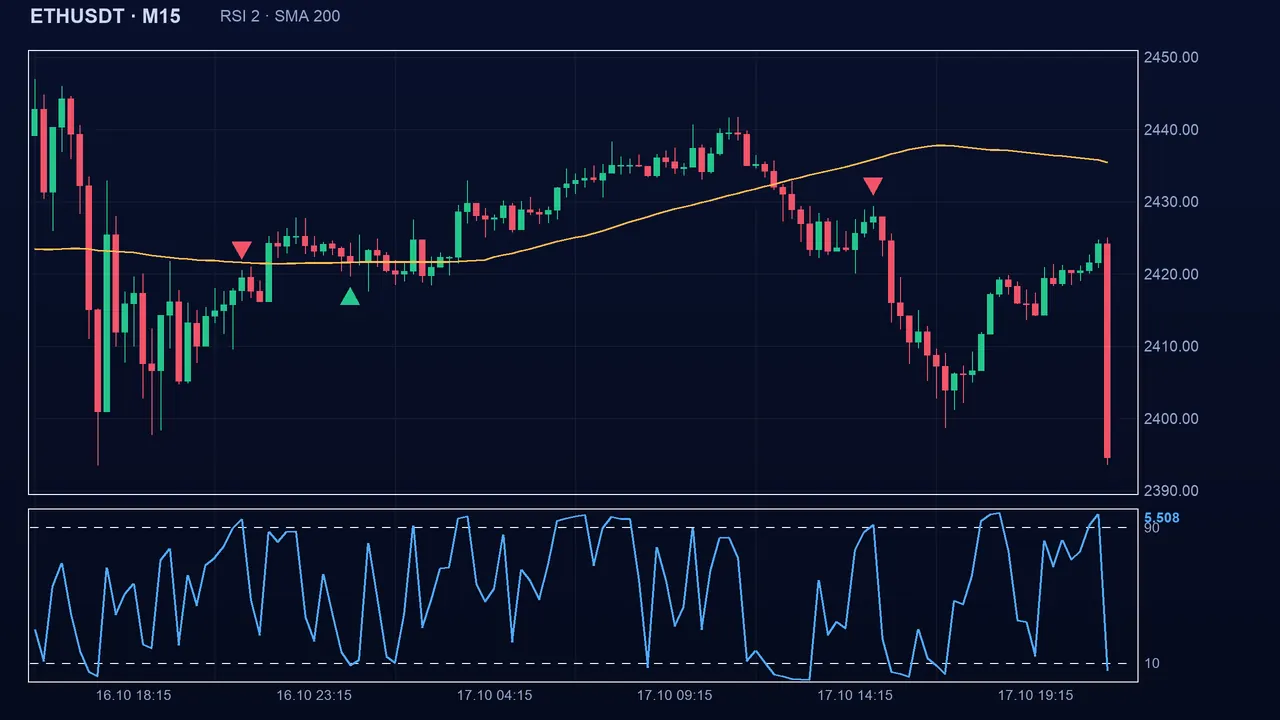
Buy when the short RSI is below 10 AND the close is above the trend average: you buy a pullback within an uptrend. Sell when it is above 90 AND the close is below the average: you sell a bounce within a downtrend. In every other case the state is neutral: the signal lasts only while both conditions are met; it is not held.
The settings
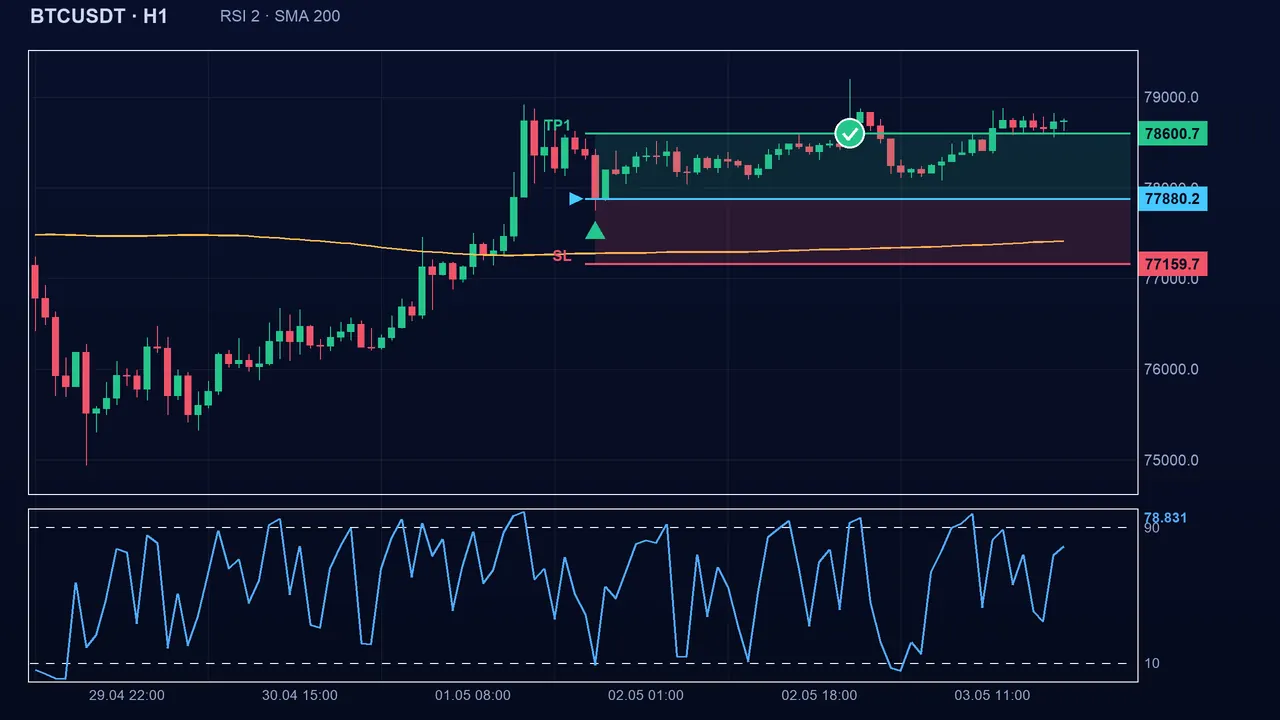
- Period (period): 2 by default (1 to 20). Longer, the RSI becomes slower and closer to the classic RSI.
- Oversold (r2Lo): 10 by default (1 to 49). Overbought (r2Hi): 90 by default (51 to 99). More extreme, fewer signals; closer, more of them but more fragile.
- Trend average period (trend): 200 by default (20 to 1000). Shorter, it lets more signals through and filters the trend less well.
- These are starting values, not proven optima.
The pitfalls
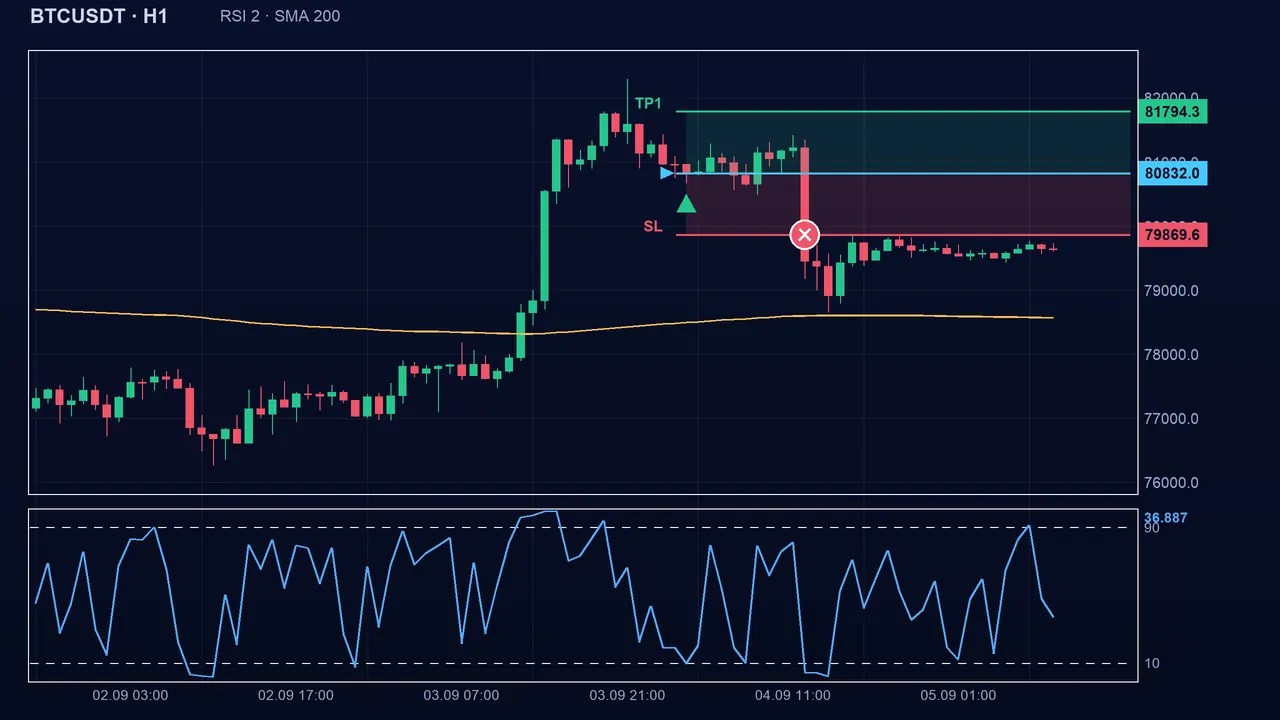
This RSI buys a fall: when it is wrong, it is wrong in the middle of a decline. A very low RSI can stay low as long as the market keeps collapsing, and bad news or a crash can break the trend average itself. The “above the average” condition is only a filter, not insurance. It also says nothing about the destination: the rebound may be tiny. On spike indices (Boom/Crash), sudden spikes often trigger it without the “mean reversion” logic applying.
Key takeaways
- 2-candle RSI, levels 10 / 90, filtered by a 200-candle average: you buy a pullback in an uptrend and sell a bounce in a downtrend.
- The signal is not held: it disappears as soon as the conditions are no longer met.
- It buys a fall: a stop is essential and position size should stay small.
- Combine it with a trend-strength indicator (ADX) or a support zone to avoid falls that keep going.
📝 Lesson test
Log in to take this lesson’s test. Once you have passed all the tests, you will receive a certificate in your name.
Log inThese lessons are for understanding and are not investment advice. No method guarantees winning.