
When price rises fast, short averages move away from long averages; when the rise runs out of steam, they come back together. The Elliott Wave Oscillator (EWO) simply measures that gap. It helps you see two things: which side the momentum is on, and when it starts to fade.
How it is calculated
We start from each candle’s median price: (high + low) ÷ 2. From it we take two simple averages, a fast one over 5 candles and a slow one over 35 candles. The EWO is their difference: fast average − slow average. It is positive when the fast one is above the slow one, negative in the opposite case, and close to zero when the market hesitates.
- “ewo” indicator: the state is the sign of the EWO. Positive = bullish, negative = bearish. A signal appears when the sign changes.
- “ewo_rev” indicator: looks for a reversal. The EWO must be negative and have formed a trough (the previous candle is lower than the one before it and than the current one). That trough must reach at least 80% of the depth of the deepest trough of the last 30 candles. For a sell, it is the mirror with a peak.
- Default values: fast 5 and slow 35; for ewo_rev, also a 30-candle look-back and a ratio of 0.8.
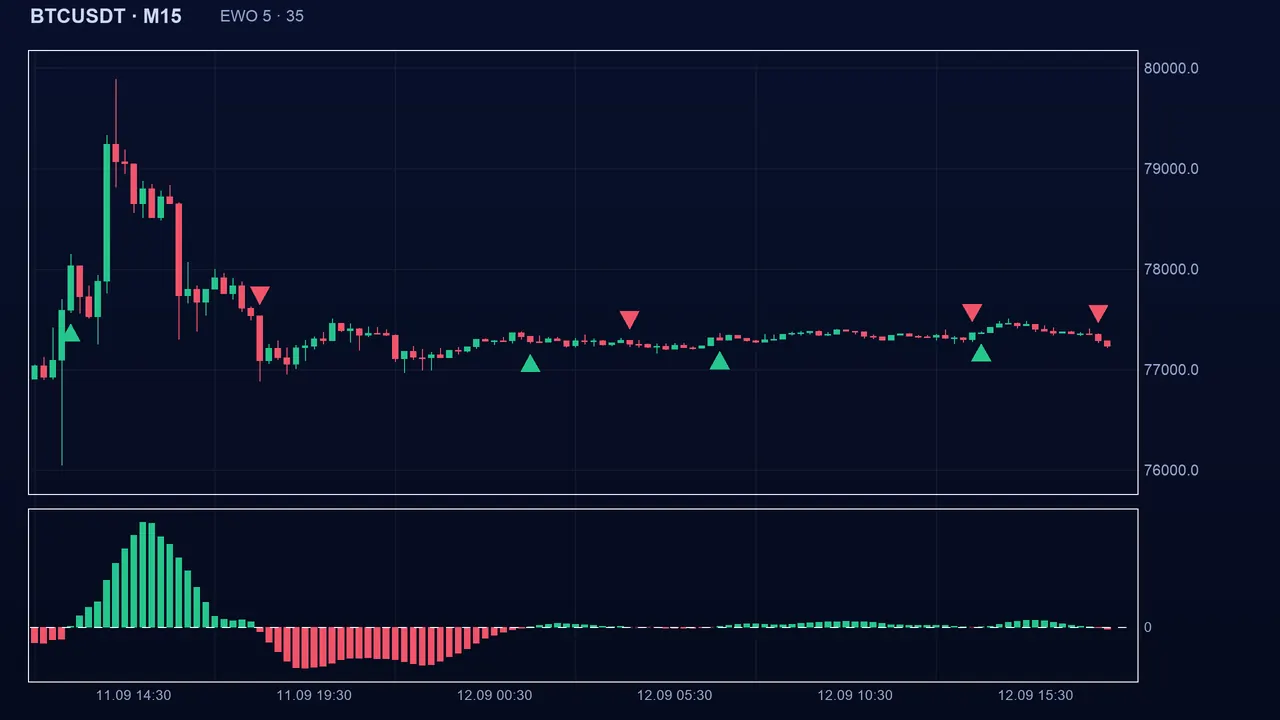
Reading the signal in Algo Signals
With ewo, a buy appears when the EWO goes from negative to positive: the short average has just crossed above the long one. It is a trend-following signal, so it arrives after the move has started. With ewo_rev, a buy appears on the candle after a deep trough: the assumption is that the decline is running out of steam. Both indicators can be enabled separately, or with others to require confluence.
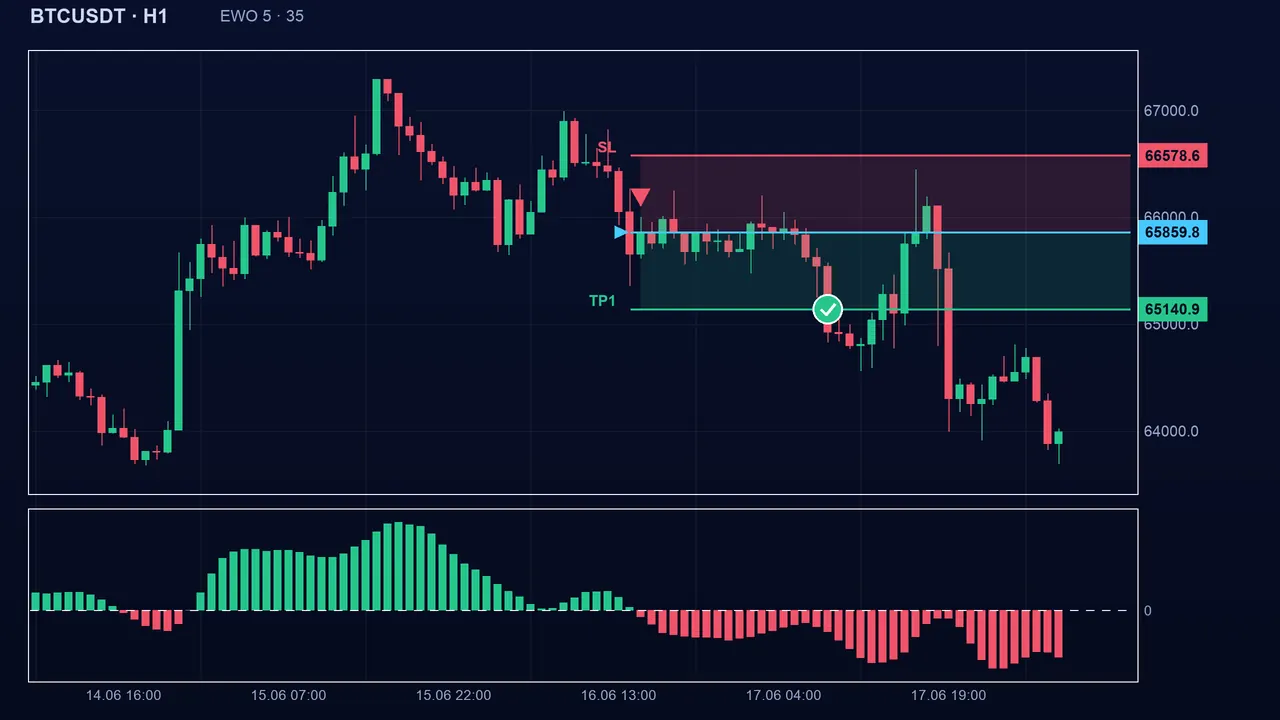
The settings
- Fast (fast, 5) and slow (slow, 35): the shorter the fast one, the quicker the EWO reacts but the more often it flips around zero. A longer slow one gives a steadier underlying trend, with later signals.
- Look-back (look, 30), for ewo_rev only: number of candles used to find the reference trough or peak. The larger it is, the deeper the trough must be compared with a longer history.
- Ratio (revRatio, 0.8): close to 1, the trough must almost equal the record; close to 0.1, small troughs are enough and signals become more numerous.
The pitfalls
Key takeaways
- EWO = fast average (5) − slow average (35) of the median price.
- ewo follows the trend (sign change); ewo_rev looks for exhaustion after a deep trough or peak.
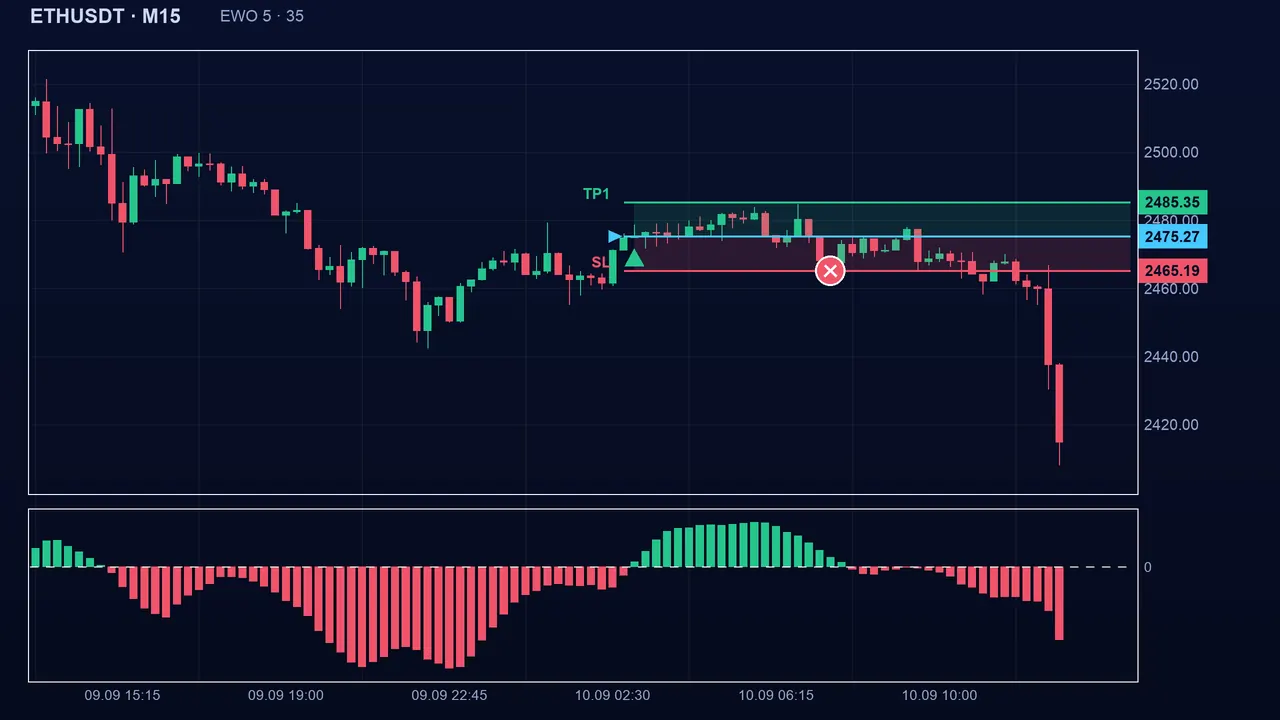
- It fails mostly in a directionless market, where the sign keeps changing.
- Always work out the stop before entering, and record your results in R.
📝 Lesson test
Log in to take this lesson’s test. Once you have passed all the tests, you will receive a certificate in your name.
Log inThese lessons are for understanding and are not investment advice. No method guarantees winning.