
What are Heikin Ashi candles for?
Heikin Ashi (“average bar” in Japanese) turns ordinary candles into smoothed candles. Each candle is calculated from the previous one, which removes many small red/green alternations and makes trends stand out as long runs of same-coloured candles. It is a readability tool: it helps you see whether the current pressure is rather buying or rather selling.
How they are calculated
- HA close = (open + high + low + close) ÷ 4 of the real candle.
- HA open = (previous HA open + previous HA close) ÷ 2. For the very first candle: (open + close) ÷ 2.
- State: bullish if the HA close is above the HA open, bearish if it is below, neutral if they are equal.
- There is no setting. Nothing is computed with the future. HA prices are averages: they are not prices at which you can really buy or sell.
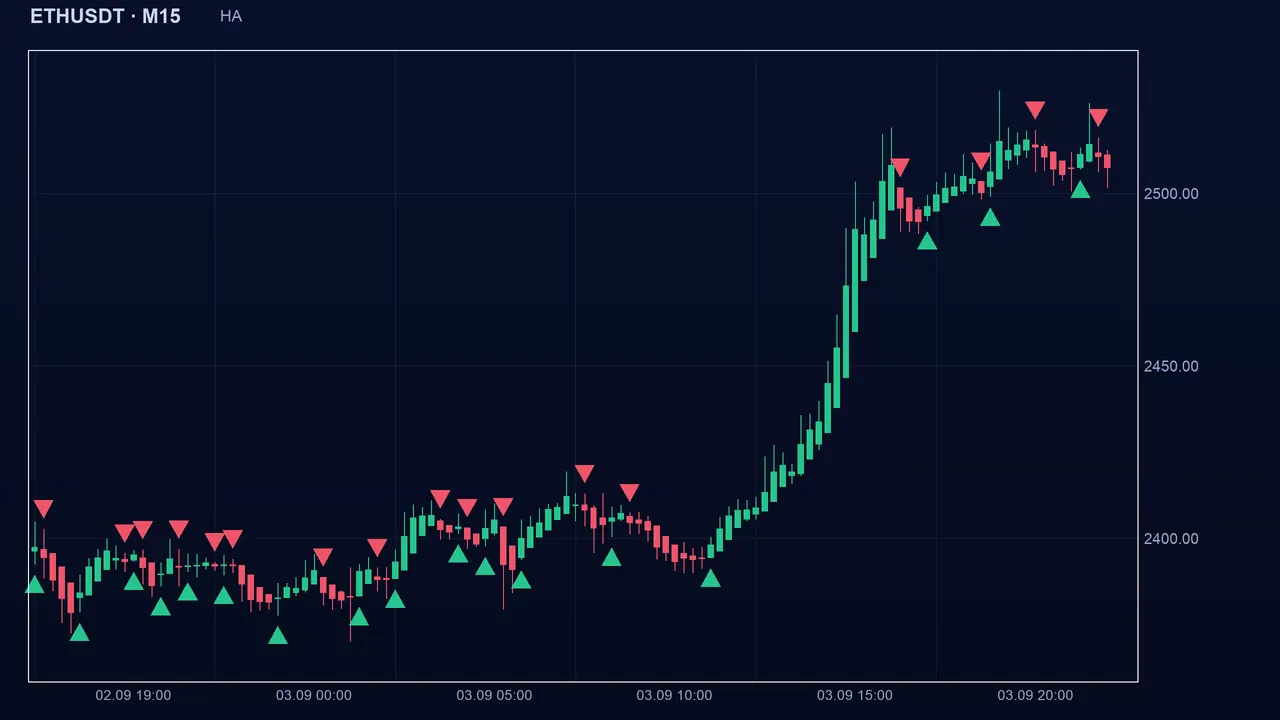
Reading the signal in Algo Signals
Heikin Ashi is a filter: when you also tick a trigger indicator, it does not vote, but a buy is kept only if the HA candles are bullish (a sell only if they are bearish). Ticked alone, it gives its own signals when the HA candle’s colour changes. The entry price remains the close of the real candle, not that of the HA candle.
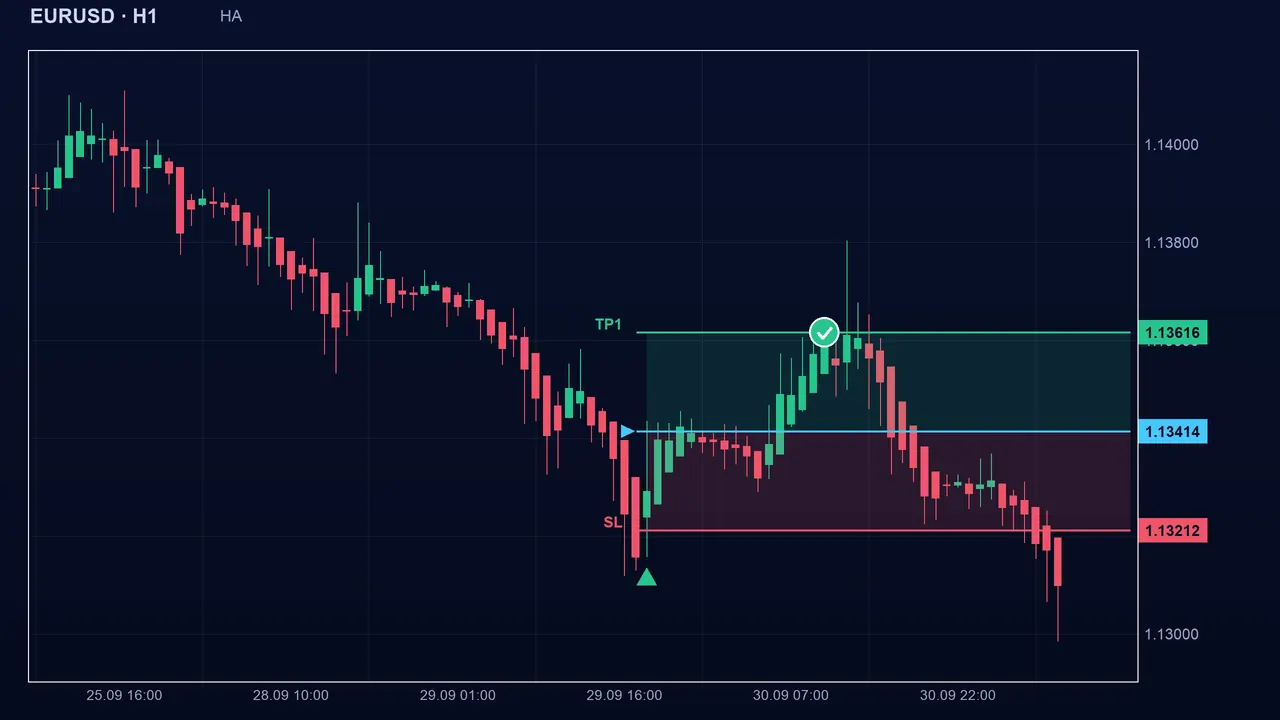
The settings
- Heikin Ashi has no setting in Algo Signals: the formula is fixed.
- What matters is the timeframe: the longer it is, the steadier but later the HA candles are.
- Used as a filter with another indicator, it removes signals that go against the dominant colour, at the price of rarer and later signals.
- Because it is smoothed, it is always a little behind price: that is part of the trade-off.
The pitfalls
Smoothing has a cost: the HA candle keeps the same colour for several candles after price has begun to turn. A “bullish” state can therefore look reassuring while your position is losing money. Also, HA prices are not real prices: do not place orders on them. Finally, in a market with no direction the colour still alternates, and a Boom/Crash spike distorts the following HA candles, because each open depends on the previous one.
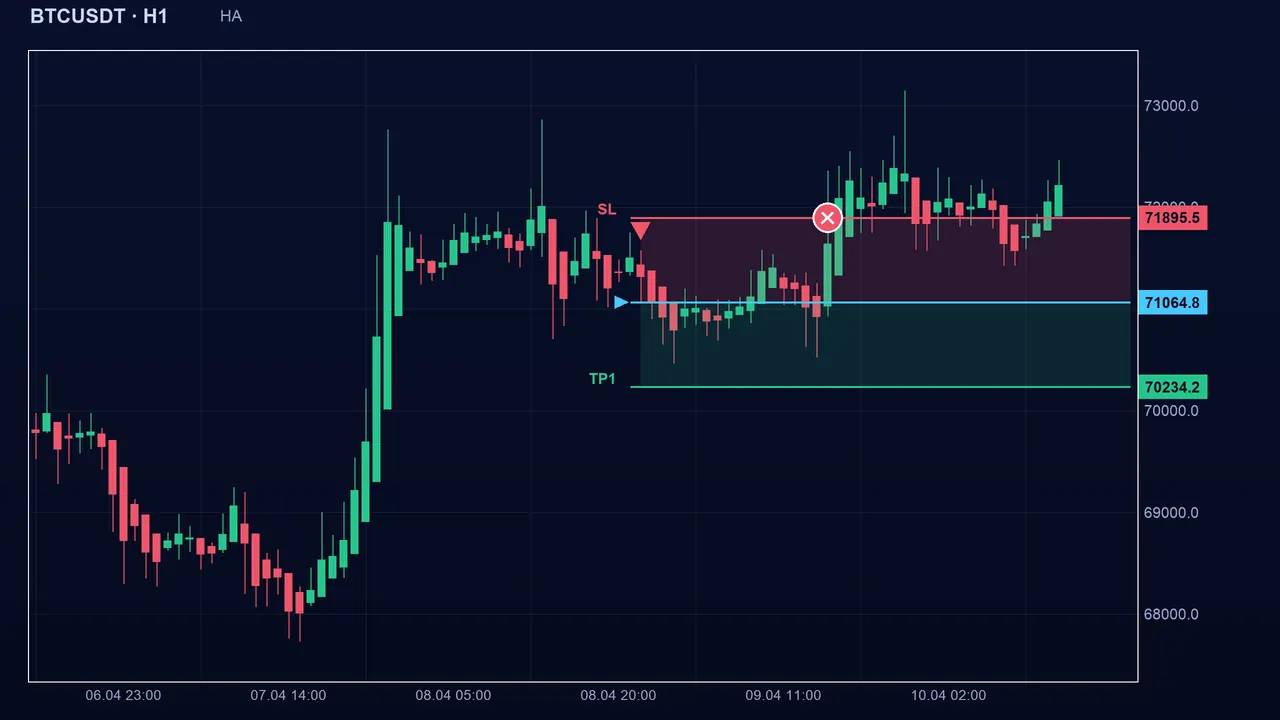
Key takeaways
- Heikin Ashi smooths candles: HA close above HA open = bullish, below = bearish.
- In Algo Signals it is a direction filter; on its own it flags colour changes.
- HA prices are not real prices, and smoothing can hide a loss in progress.
- No setting: the formula is fixed.
📝 Lesson test
Log in to take this lesson’s test. Once you have passed all the tests, you will receive a certificate in your name.
Log inThese lessons are for understanding and are not investment advice. No method guarantees winning.