
When a trend rises, price does not climb in a straight line: it dips a little, then resumes. The trend pullback (pullback in Algo Signals) looks for that exact moment, rather than chasing price in mid-rally.
What the pullback is for
The idea is to avoid buying right at the top. You wait for an uptrend to be established, for price to dip below a short average, then to move back above it. The signal marks that restart. Selling works as a mirror image in a downtrend.
How it is calculated
Three exponential averages (EMA) of closing prices: fast 20, mid 50, slow 200. An uptrend is recognised if the EMA 50 is above the EMA 200 and the close is above the EMA 200. The buy signal then requires two things: the previous close was below the EMA 20 (the dip), and the current close moves back above the EMA 20. For sells everything is reversed: EMA 50 below EMA 200, close below EMA 200, previous close above EMA 20, current close below EMA 20.
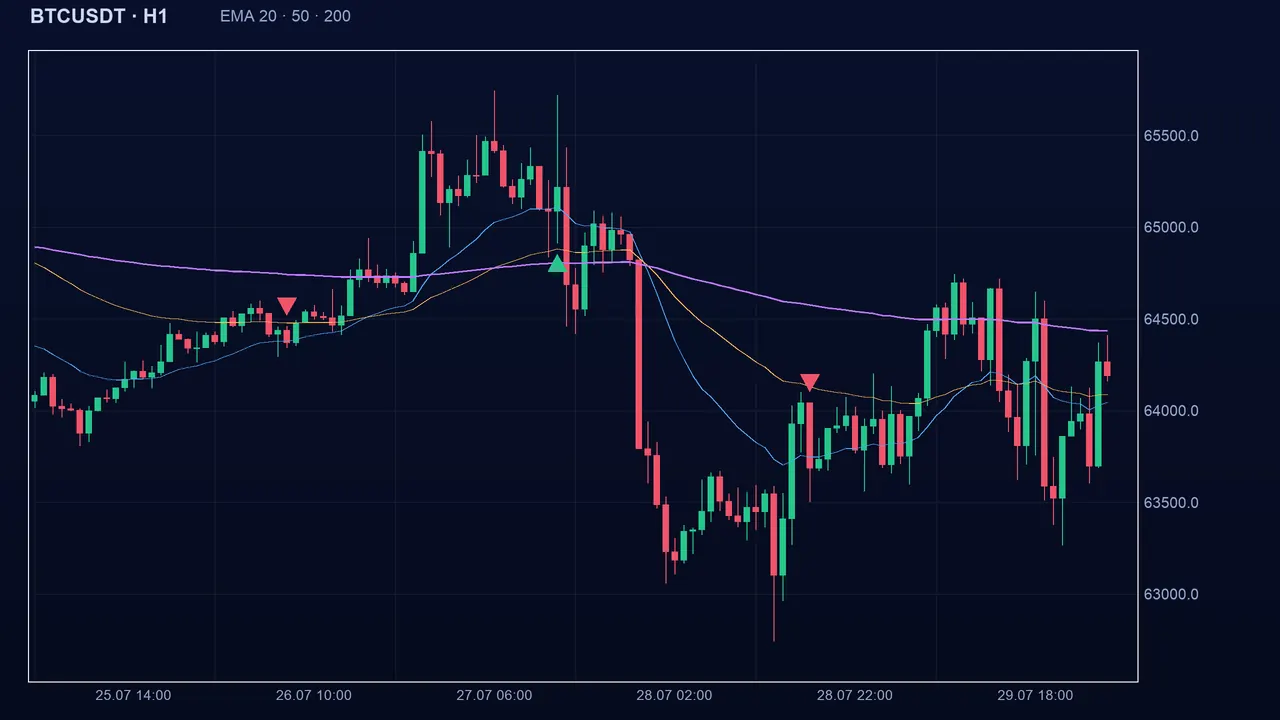
Reading the signal in Algo Signals
Unlike macross, the pullback is not a lasting state: it is +1 or −1 only on the candle where the event happens, then goes neutral again. When it is the only indicator ticked, two buys in a row are not repeated: a sell signal must have occurred in between.
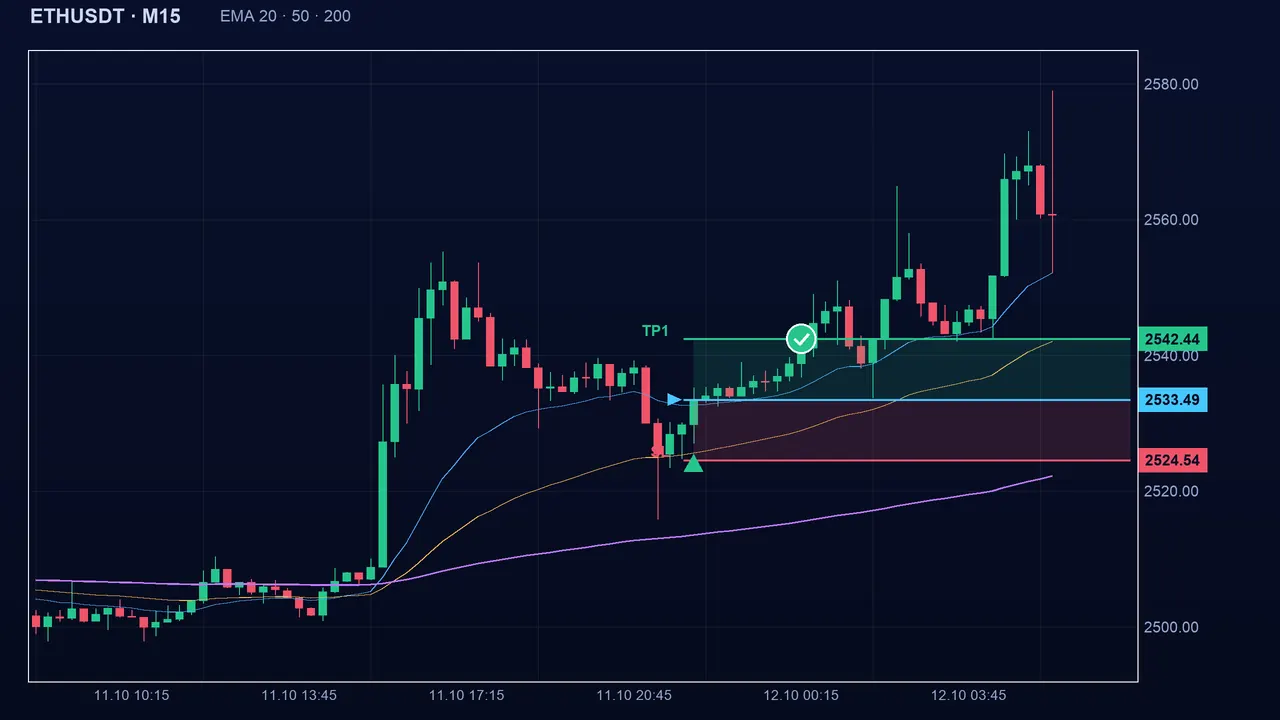
The settings
- Fast EMA (fast): 20 by default, from 2 to 200. Shorter, the dips detected are smaller and more frequent.
- Mid EMA (mid): 50 by default, from 3 to 300. It is used to recognise the trend.
- Slow EMA (slow): 200 by default, from 20 to 1000. It acts as a floor (a ceiling for sells).
- Keep fast < mid < slow, otherwise the trend conditions make no sense.
The traps
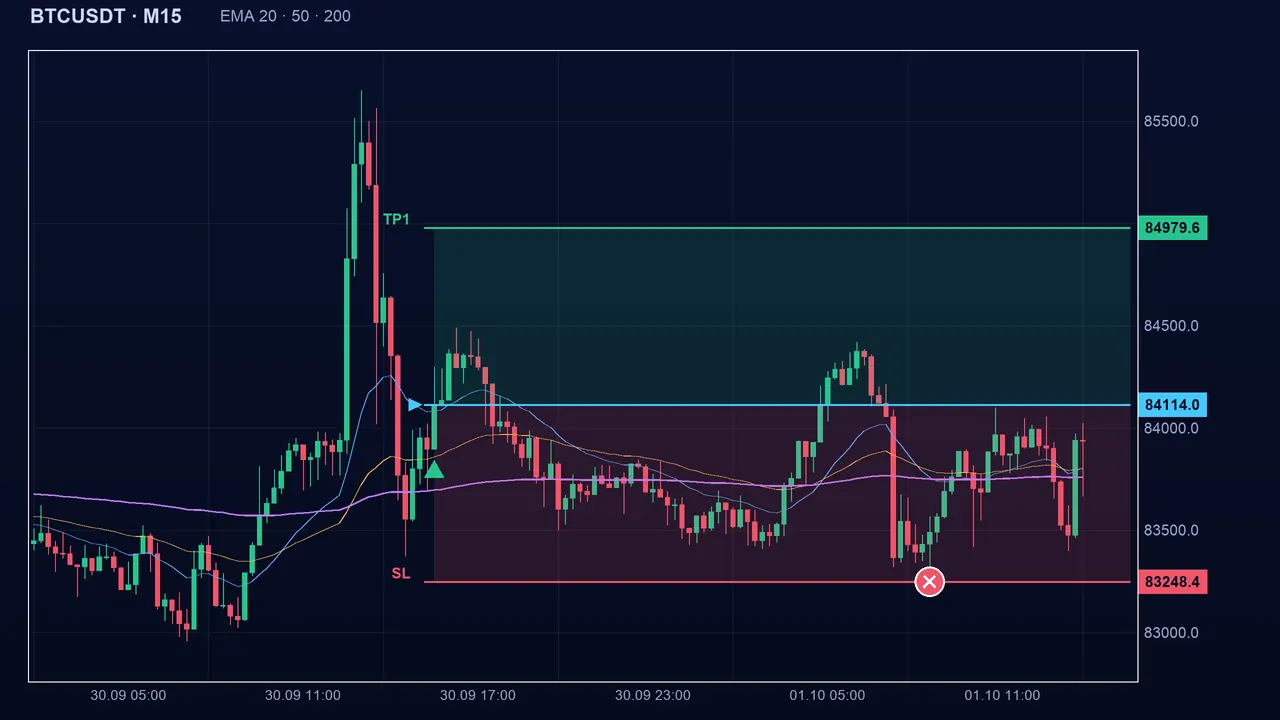
The required “trend” is very simple: the EMA 50 above the EMA 200, even by a hair. In an almost flat market these two lines touch and the condition can be met without a real trend. A dip can also be the start of a reversal.
Key takeaways
- The pullback waits for a trend (EMA 50 and close on the right side of the EMA 200), a dip below the EMA 20, then a return above it.
- The signal lasts one candle; it is read at the instant it appears.
- A very weak trend (EMA 50 hugging the EMA 200) is enough to meet the condition: check the gap.
- Pair it with the ADX to gauge trend strength, and with a stop below the dip’s low if you find it useful.
📝 Lesson test
Log in to take this lesson’s test. Once you have passed all the tests, you will receive a certificate in your name.
Log inThese lessons are for understanding and are not investment advice. No method guarantees winning.