
When a signal appears, one question remains: where to put the stop-loss and where to take profit? The ATR method answers with a simple measure, the average size of a candle at the moment. If the market is quiet, the stop is close; if it is agitated, the stop moves away.
How the levels are calculated
The ATR (Average True Range) is computed over 14 candles: it is the average true range, that is the largest of high − low and the gap from the previous close. The entry price is the close of the signal candle. If the ATR is not available yet (start of the history), Algo Signals uses 0.3% of the price instead.
- Risk = stop multiplier × ATR (1.5 × ATR by default).
- Stop-loss: at the “risk” distance from entry, on the losing side (below entry for a buy, above for a sell).
- Target 1 (TP1): entry + 1 × risk, in the direction of the trade (TP1 ratio = 1).
- Target 2 (TP2): entry + 2 × risk (TP2 ratio = 2).
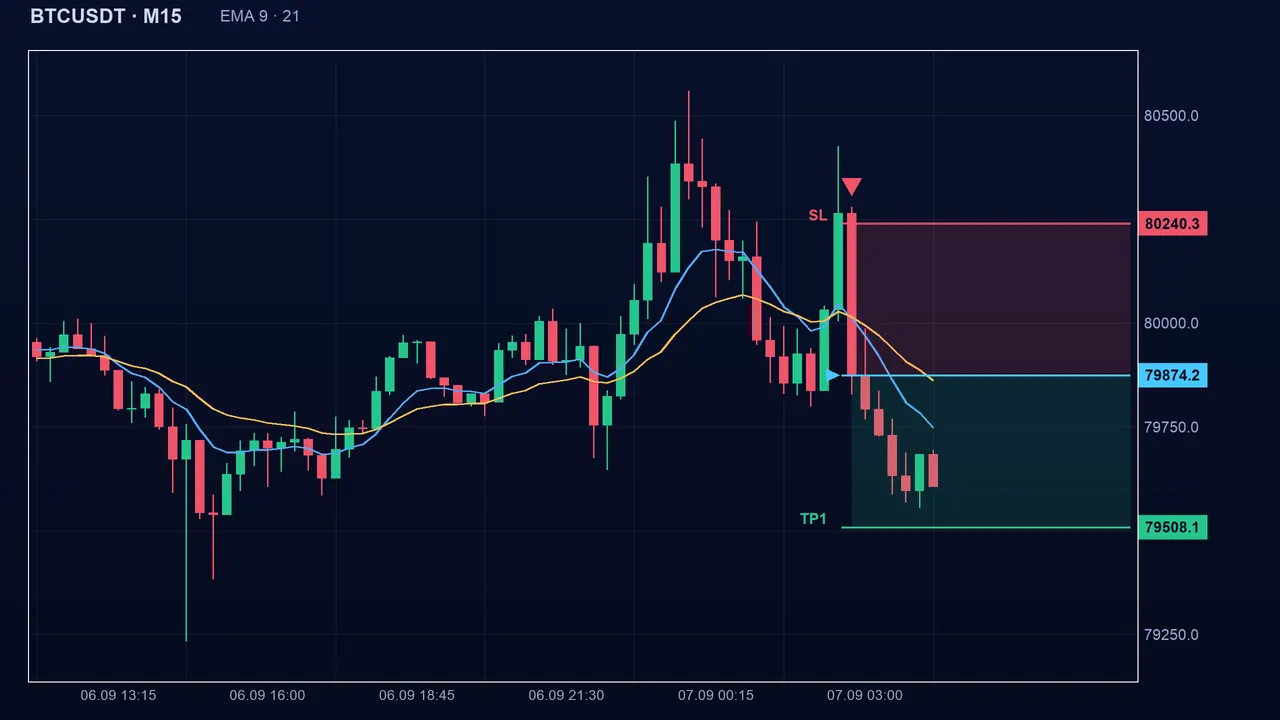
A worked case
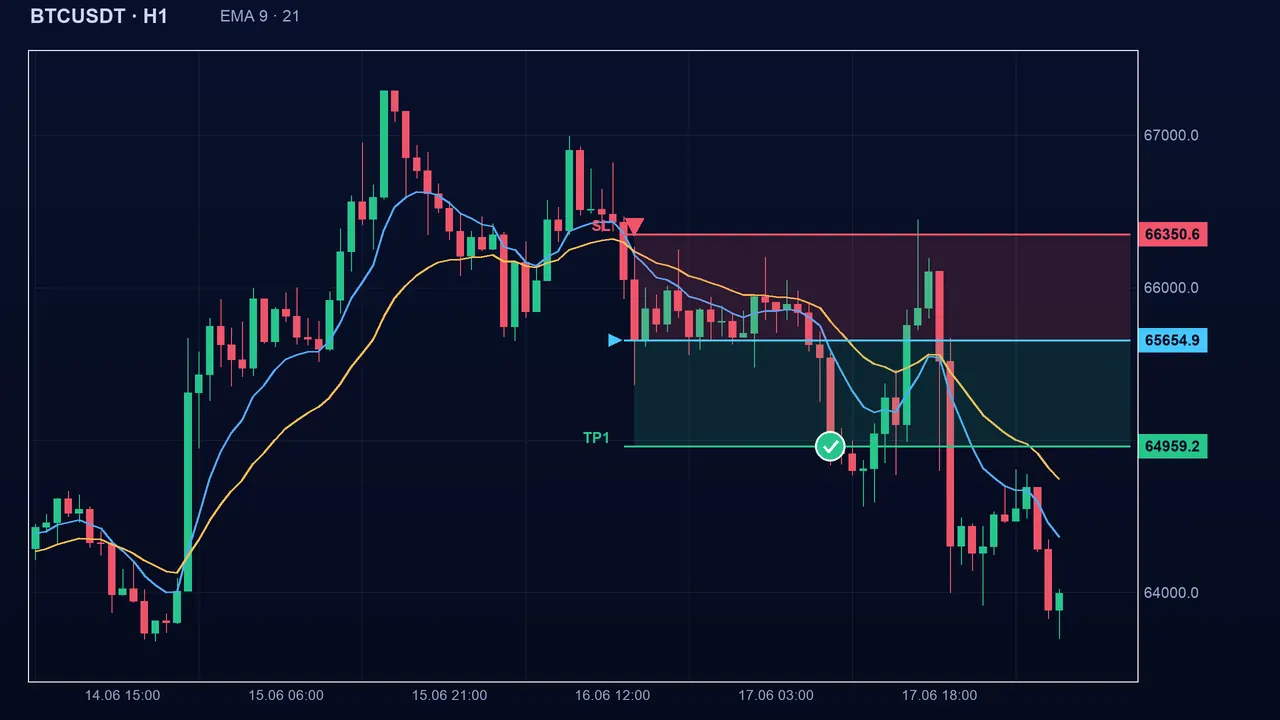
With a 1:1 ratio you need more than 50% winning trades to break even (before fees and spread); with 1:2, a little over 33%. Position size follows from the stop: with $1,000 and 1% risk ($10), the stop distance sets the size, not the other way around.
Settings and safeguards
- Stop multiplier (slMult): 1.5 by default, from 0.1 to 10. Smaller, the stop is tight and often hit by plain noise; larger, the loss per trade grows (reduce the size).
- TP1 ratio (rr1): 1 by default, from 0.2 to 10.
- TP2 ratio (rr2): 2 by default, from 0.4 to 20.
- With slMult = 3 on the example, the risk becomes 0.0030: stop 1.0820, TP1 1.0880, TP2 1.0910. The targets move away too, because they are multiples of the risk.
This is an explicit-ratio method: your ratios are kept. The safeguards only check three points: the stop is on the losing side and more than 0.1 ATR from entry (otherwise it is brought back to 1.5 ATR), TP1 is on the winning side, TP2 is farther than TP1. The stop cap and the minimum ratios of the safeguards do not apply to the ATR method.
The pitfalls
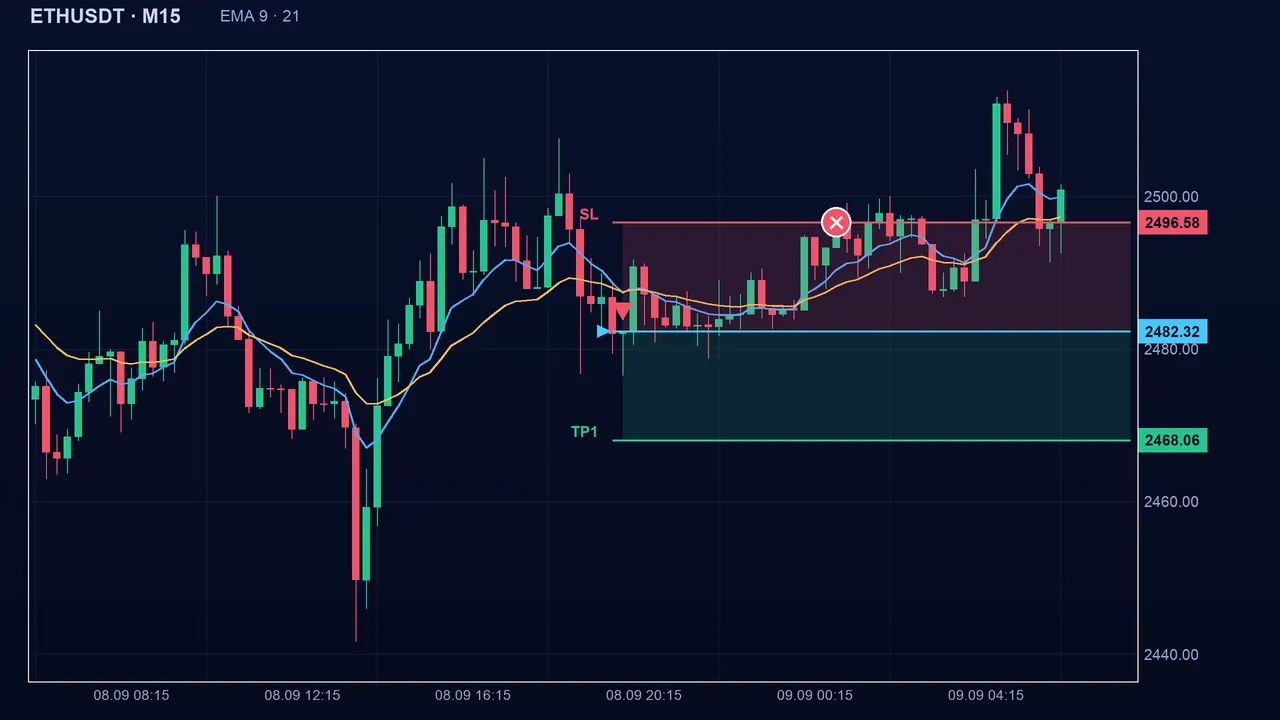
The ATR method looks at no support, no resistance and no structure: the stop may land in the middle of an unimportant zone. The ATR is also lagging: it describes the last 14 candles, not the volatility to come.
Key takeaways
- The stop is 1.5 ATR by default; TP1 and TP2 are 1 and 2 times that risk.
- The reward-to-risk ratio is set with rr1 and rr2; a high ratio is not better in itself, the target is reached less often.
- The stop adapts to volatility, but not to the chart’s structure.
- Before choosing, compare with level-based methods (swing, support/resistance) on the same history.
📝 Lesson test
Log in to take this lesson’s test. Once you have passed all the tests, you will receive a certificate in your name.
Log inThese lessons are for understanding and are not investment advice. No method guarantees winning.