
Why keep a journal?
An indicator, even well tuned, is only worth what you actually get from it. The site’s trade journal (free, in “Trader tools”) is for noting each trade and answering one question honestly: does my result come from a real edge or from chance?
What the journal calculates
For each trade, you enter the date, market, direction, entry, exit, size, stop-loss (optional), fees, a strategy tag and a note. Your data stays in your browser: export it regularly as CSV. The journal calculates the number of trades, the win rate with its 95% confidence interval, total result, expectancy per trade, profit factor, average win and loss, win/loss ratio, maximum loss (drawdown) and streaks.
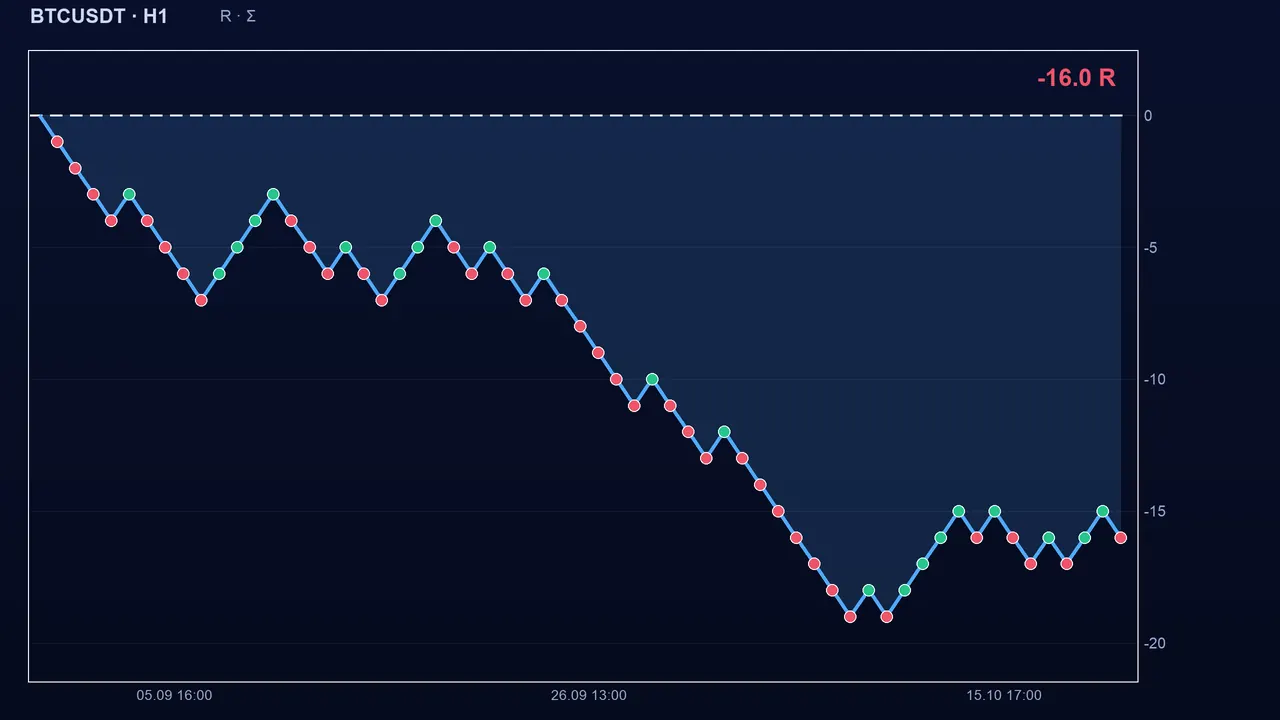
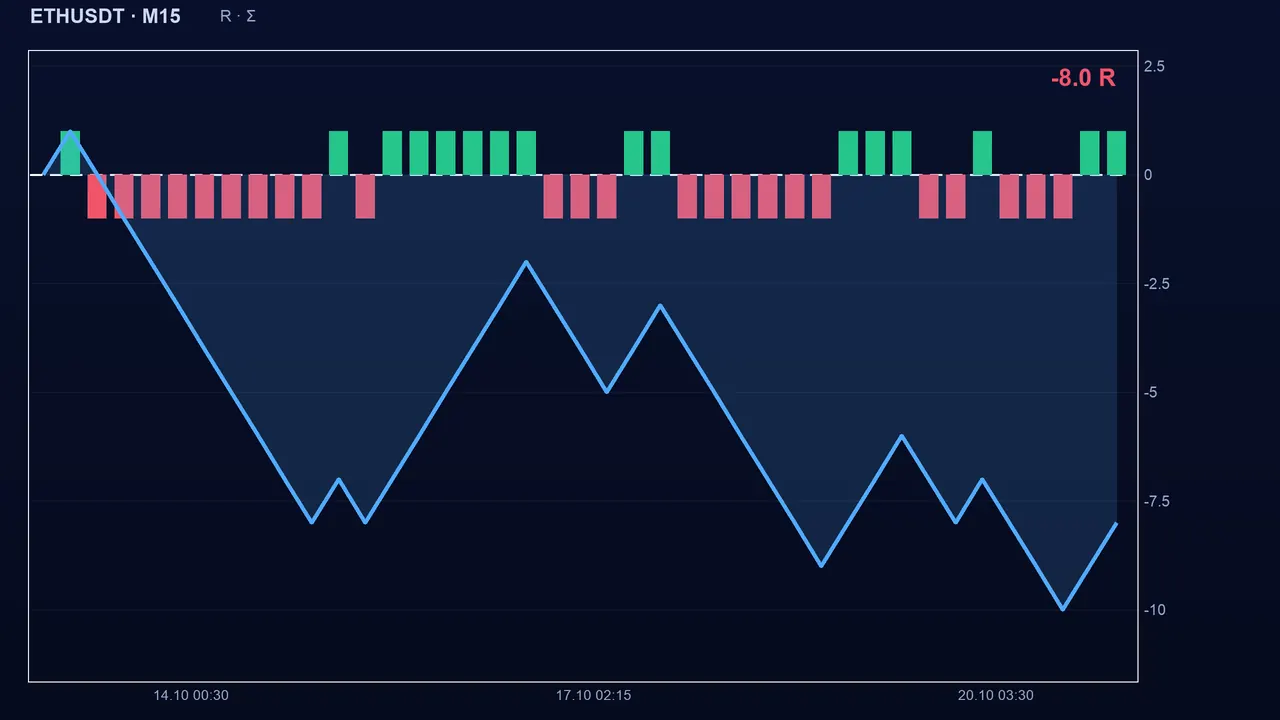
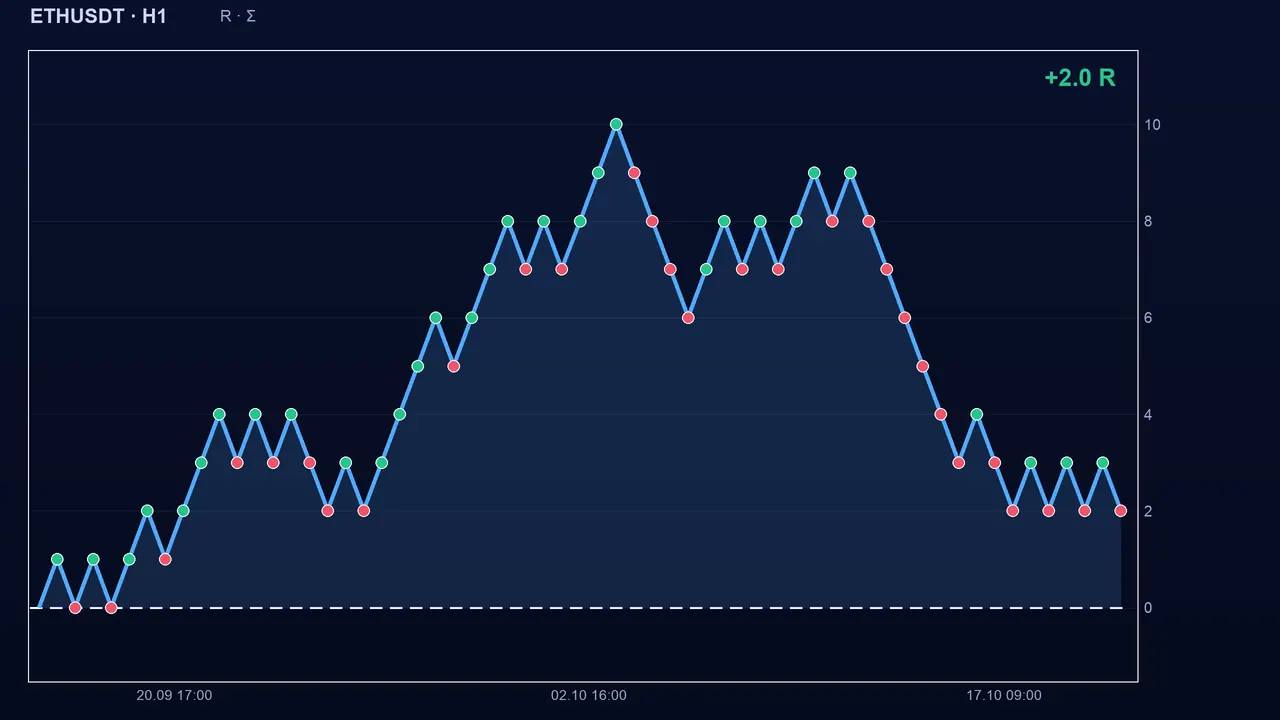
If you fill in the stop-loss, it also calculates expectancy in R (result divided by the risk taken). The “Is your edge real?” test replays your trades 5,000 times at random (resampling) to estimate the probability that your true expectancy is zero or negative: under 5%, the edge looks real; above 30%, nothing proves it; in between, the result is encouraging but uncertain. With fewer than 30 trades, the statistics are considered too fragile.
Reading your statistics
What to conclude? The result is positive but fragile: with an expectancy of $1.40 and a standard deviation of about $26 per trade, it would take more than 1,300 trades (about 1,346) to tell this result apart from zero at 95%. The reliability test would probably show a probability above 30%: nothing proves an edge yet. That is useful information, not a failure.
The site’s calculators
- Loss and recovery: losing 20% requires a 25% gain to get back to zero (100 × 20 ÷ 80); losing 50% requires +100%.
- Reward-to-risk ratio: a trade’s ratio and the minimum win rate to break even.
- Expectancy and profit factor, gain or loss with fees, pip value, margin and liquidation.
- Risk of ruin (3,000 simulated series), lot optimizer, consistency of results (weight of the best day).
The pitfalls
Key takeaways
- Note every trade, with its stop: expectancy in R lets you compare your trades with each other.
- Compare the win rate with the break-even rate set by your win/loss ratio.
- Fewer than 30 trades: the figures are too fragile to conclude.
- The reliability test estimates whether your expectancy could be due to chance; under 5% the edge looks real, above 30% nothing proves it.
📝 Lesson test
Log in to take this lesson’s test. Once you have passed all the tests, you will receive a certificate in your name.
Log inThese lessons are for understanding and are not investment advice. No method guarantees winning.