
Deriv’s Boom and Crash indices are famous for their “spikes”: sudden moves that make people dream. Algo Spikes is the Algo Signals indicator that tries to pick an entry point on these markets, and on the Volatility indices too. This lesson explains how it works, then plainly says what the tests showed.
Boom, Crash and Volatility in brief
Boom drifts slowly down with, on average, a sudden spike up every 500 or 1000 ticks; Crash does the opposite. They are simulated indices: the timing of a spike is drawn at random, so it is unpredictable. The Volatility indices have no spikes, only a larger or smaller amplitude.
How it is calculated
- Stochastic (period 14, smoothing 3): buy when it crosses up through its signal line while its value is below 13. Sell: cross down above 87.
- RSI(14) of the M15 timeframe strictly between 40 and 60, so neutral. On a shorter timeframe (M1, M5), it is the current value of the running M15 candle, computed without looking ahead. From M15 up, it is the RSI of the candle itself.
- Bollinger (50-candle average, 1.1 standard deviations): the previous candle’s close is below the lower band for a buy, above the upper band for a sell.
- All three conditions must be met. The side setting limits the indicator (0 = both ways, 1 = buys only for Boom, −1 = sells only for Crash). No volume is used.
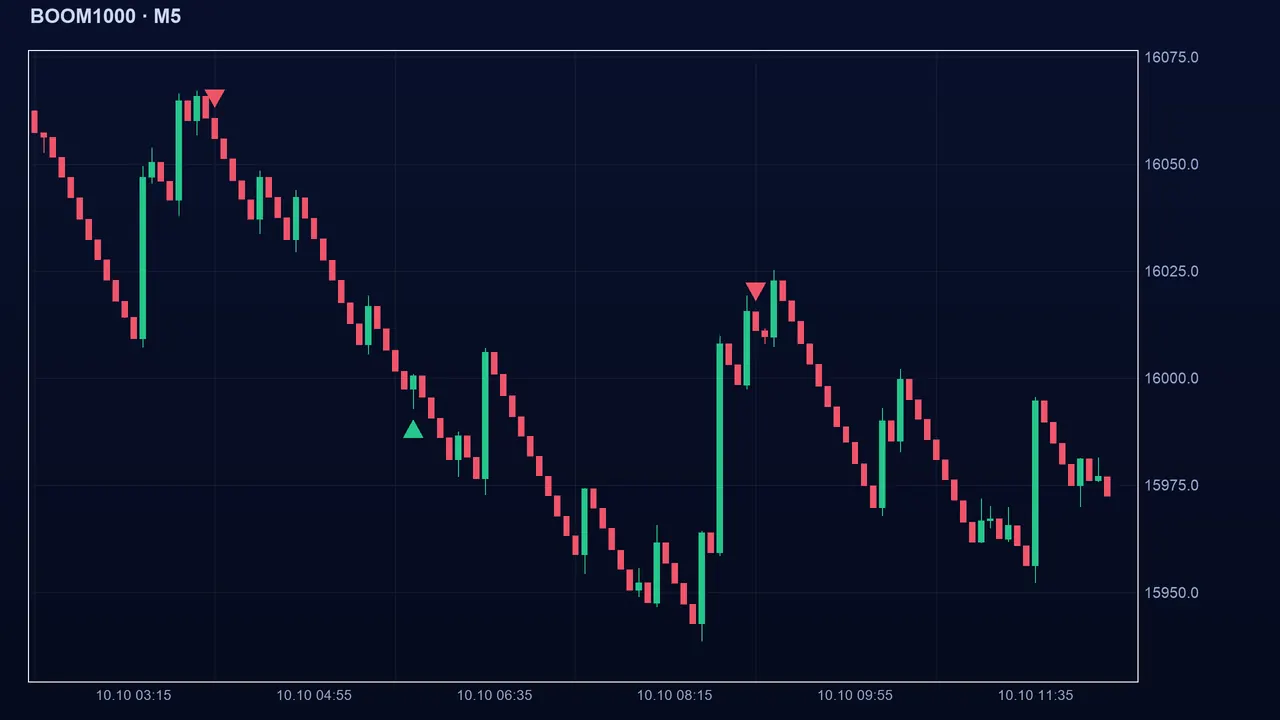
Reading the signal in Algo Signals
An arrow appears on the candle of the stochastic cross, when the other two conditions are met. The signal is a one-off and does not repaint; no state is held.
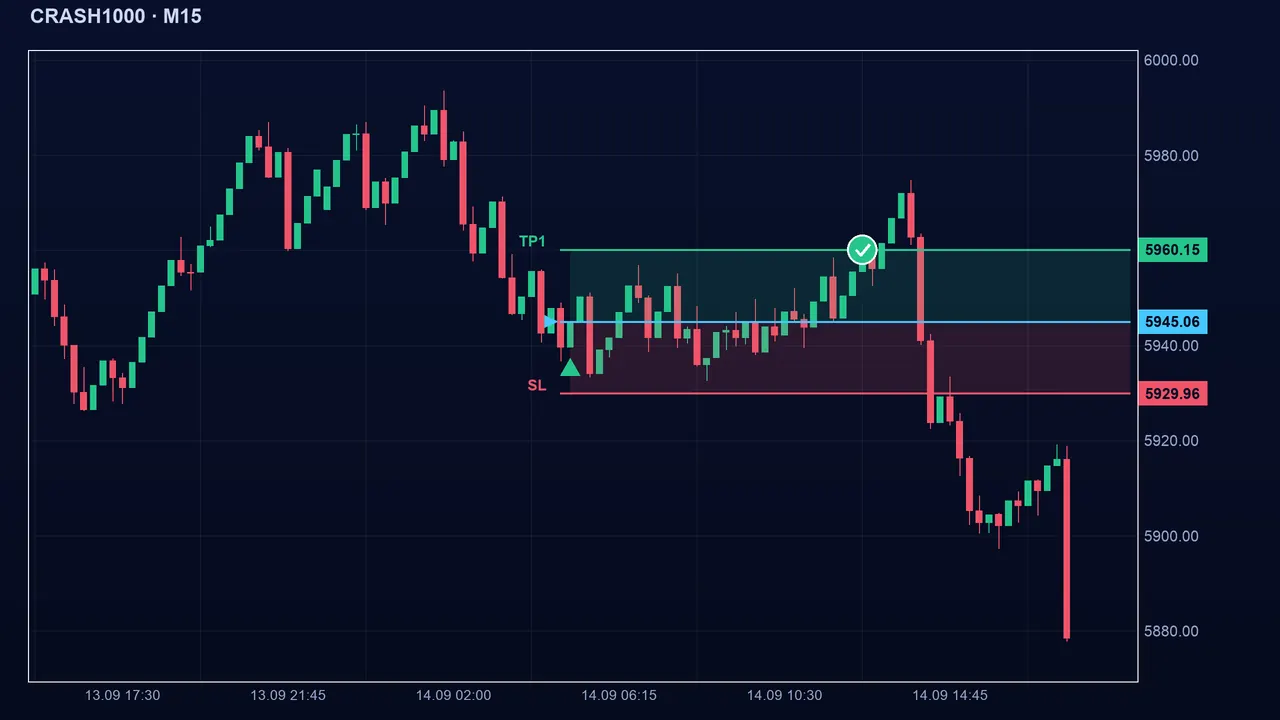
Settings and what the tests showed
- Stochastic: period (14, from 2 to 100), low threshold (13, from 1 to 49), high threshold (87, from 51 to 99).
- M15 RSI: lower bound (40, from 1 to 49) and upper bound (60, from 51 to 99).
- Bollinger: period (50, from 5 to 300) and standard deviation (1.1, from 0.3 to 4). Side: 0, 1 or −1.
The owner’s tests showed no reliable edge. With a reasonable stop, Boom and Crash lose about 0.3 R per trade on average (R = the risk taken on a trade), and Volatility is close to zero. Between 70 and 80% of signals reach the first target when trading without a stop, but that figure hides rare, very large losses. The indicator remains available because it is transparent, not because it has proven it makes money.
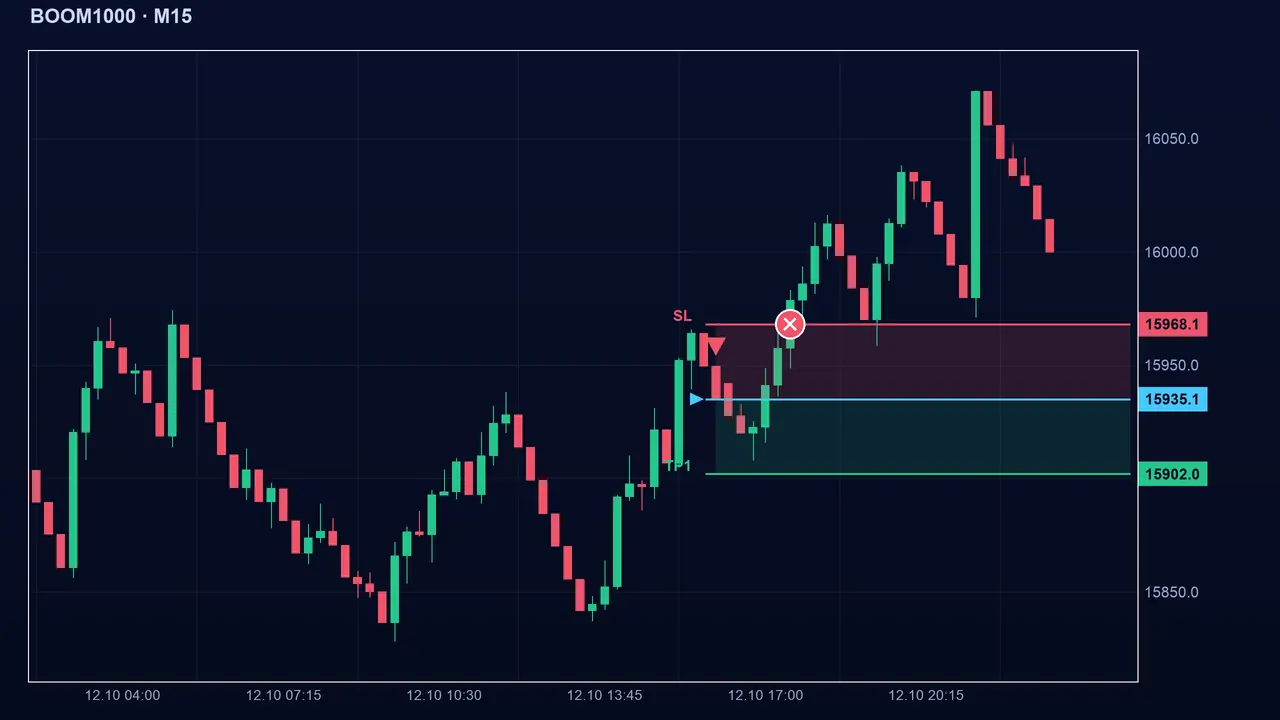
Key takeaways
- Algo Spikes = a stochastic cross in an extreme zone + neutral M15 RSI (40 to 60) + previous close outside the Bollinger band.
- Boom and Crash spikes are random: the indicator does not predict them.
- The owner’s tests: no reliable edge; about −0.3 R per trade on Boom and Crash with a reasonable stop, close to zero on Volatility.
- A 70 to 80% success rate says nothing without the size of the losses.
📝 Lesson test
Log in to take this lesson’s test. Once you have passed all the tests, you will receive a certificate in your name.
Log inThese lessons are for understanding and are not investment advice. No method guarantees winning.