
A price can rise fast or slowly, and that speed often changes before the direction does. The MACD (Moving Average Convergence Divergence) measures this momentum: it compares a fast exponential average with a slow one and shows whether the gap is widening or closing. It is a follower: it describes the recent past and predicts nothing.
How it is calculated
Algo Signals starts from closing prices. It computes two exponential averages (EMA), which give more weight to recent candles: a fast one over 12 candles and a slow one over 26. Each update uses the coefficient 2 ÷ (period + 1), about 0.154 for 12 and 0.074 for 26.
- MACD line = EMA 12 − EMA 26. It is positive when the fast average is above the slow one.
- Signal line = exponential average of 9 values of the MACD line: a smoothed version of the MACD.
- MACD − signal gap (the “histogram” of classic platforms): in Algo Signals only its sign matters. Positive = bullish, negative = bearish.
Reading the signal in Algo Signals
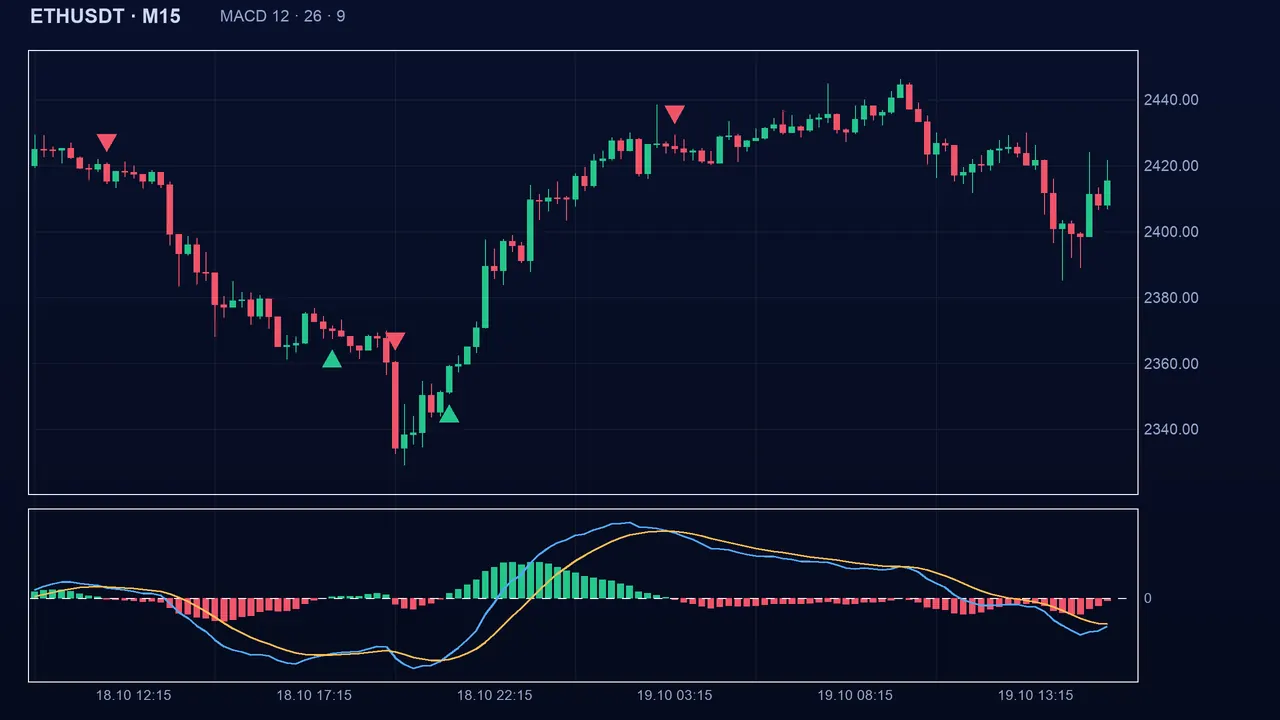
The state is bullish while the MACD line is above its signal line and bearish while it is below. A buy signal appears when the state flips from bearish to bullish (an upward crossover), a sell signal in the other direction. The zero level plays no role: only the crossover counts. During the first candles (about 34) the averages are not ready and the state stays neutral.
The settings
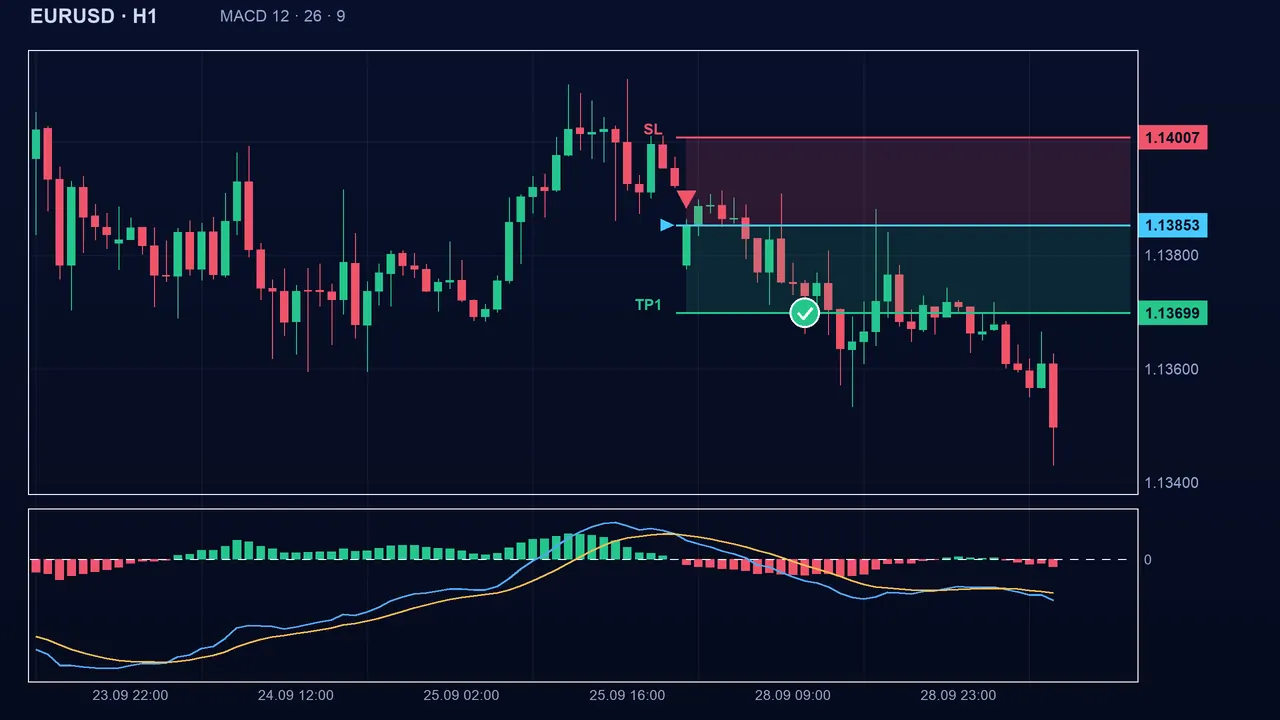
- Fast (fast): 12 by default (1 to 200). Smaller, the MACD reacts faster but crosses more often.
- Slow (slow): 26 by default (1 to 400). Larger, it follows long moves, with more lag.
- Signal (signal): 9 by default (1 to 200). Smaller, crossovers come sooner and more often; larger, they are rarer and later.
- 12-26-9 is the historical convention, not a proven optimum. Hunting for the best setting on past data leads to overfitting.
The pitfalls
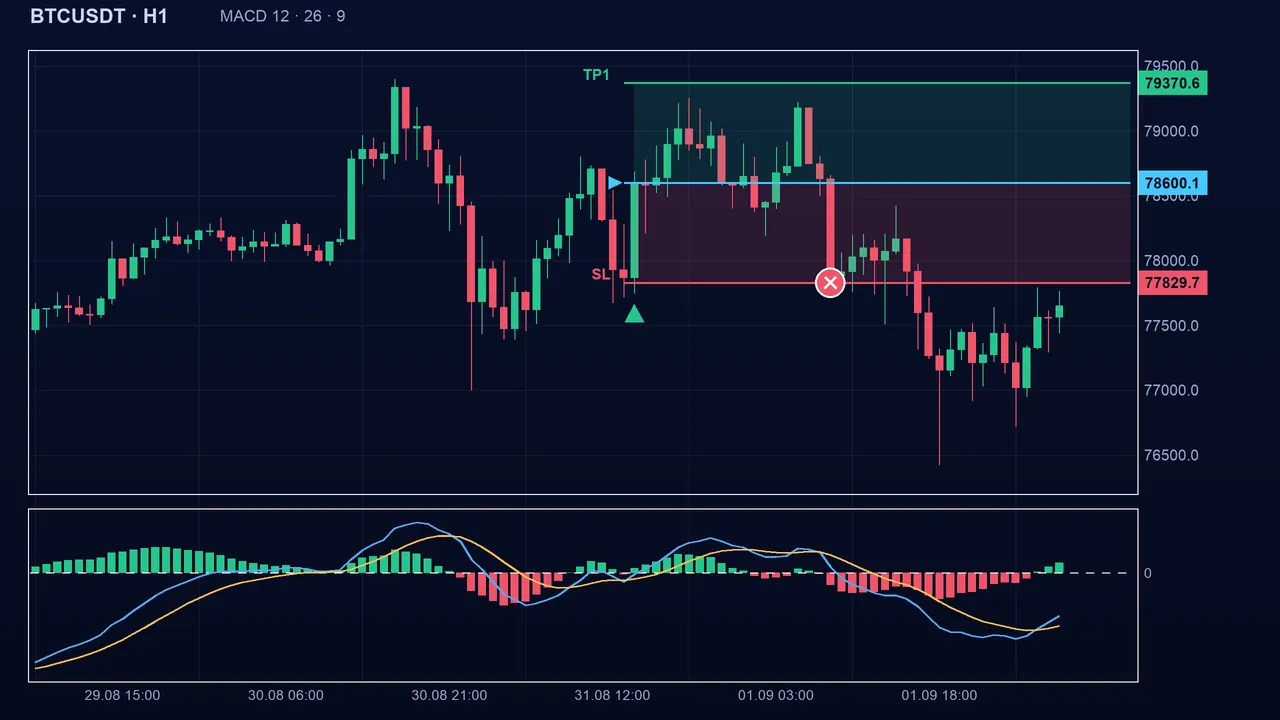
The MACD is a trend indicator dressed as an oscillator. When the market has no direction, the MACD line circles around its signal line and crossovers follow one another with no follow-through. It also arrives late: the crossover confirms a move that has already started. On spike indices (Boom/Crash), a sudden spike can distort the averages and create meaningless crossovers.
Key takeaways
- MACD = EMA 12 − EMA 26; signal = EMA 9 of the MACD; buy when the MACD crosses above the signal, sell when it crosses below.
- It measures momentum with a delay: it confirms, it does not anticipate.
- It struggles in a flat market: crossovers multiply and small losses pile up.
- Combine it with a trend filter (ADX, MA 200) or an extreme indicator (RSI): Algo Signals lets you require several indicators to agree.
📝 Lesson test
Log in to take this lesson’s test. Once you have passed all the tests, you will receive a certificate in your name.
Log inThese lessons are for understanding and are not investment advice. No method guarantees winning.