
What is Ichimoku for?
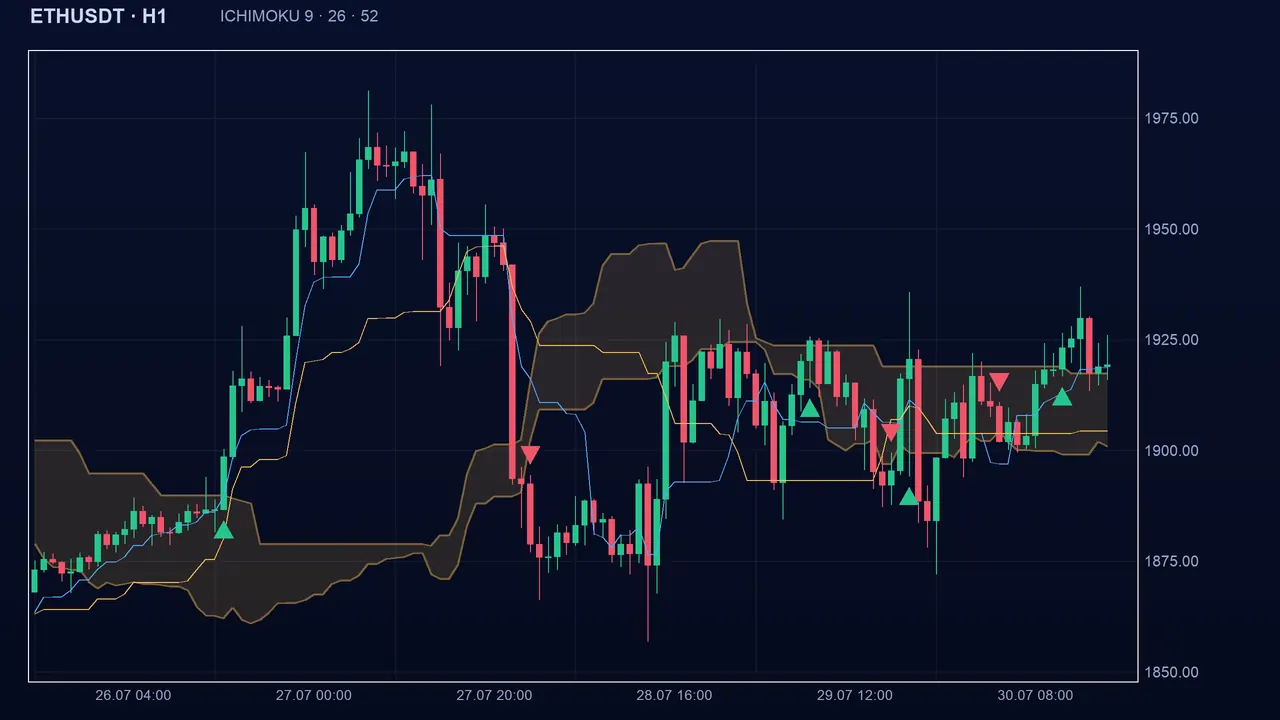
Ichimoku Kinko Hyo is a Japanese indicator that sums up, on a single chart, the market’s direction and likely support zones. Instead of one line, it draws a “cloud”: a coloured zone that serves as a reference. Price above the cloud: the trend is rather bullish. Price below: rather bearish. Price inside: the market is hesitating. The idea is simple: avoid buying or selling when price is stuck in a zone of hesitation.
How it is calculated
- Tenkan (9 candles by default): the midpoint between the highest high and the lowest low of the last 9 candles. This is the fast line.
- Kijun (26 candles): the same calculation over 26 candles. This is the slow line.
- Senkou A: the average of Tenkan and Kijun. Senkou B: the midpoint between the highest high and the lowest low of the last 52 candles.
- The cloud is the zone between Senkou A and Senkou B, shifted 26 candles forward: for the current candle, Algo Signals uses the cloud computed 26 candles earlier. Nothing is computed with the future, so the signal does not repaint.
- The Chikou line (the close shifted backwards) of classic Ichimoku is not used by Algo Signals.
Reading the signal in Algo Signals
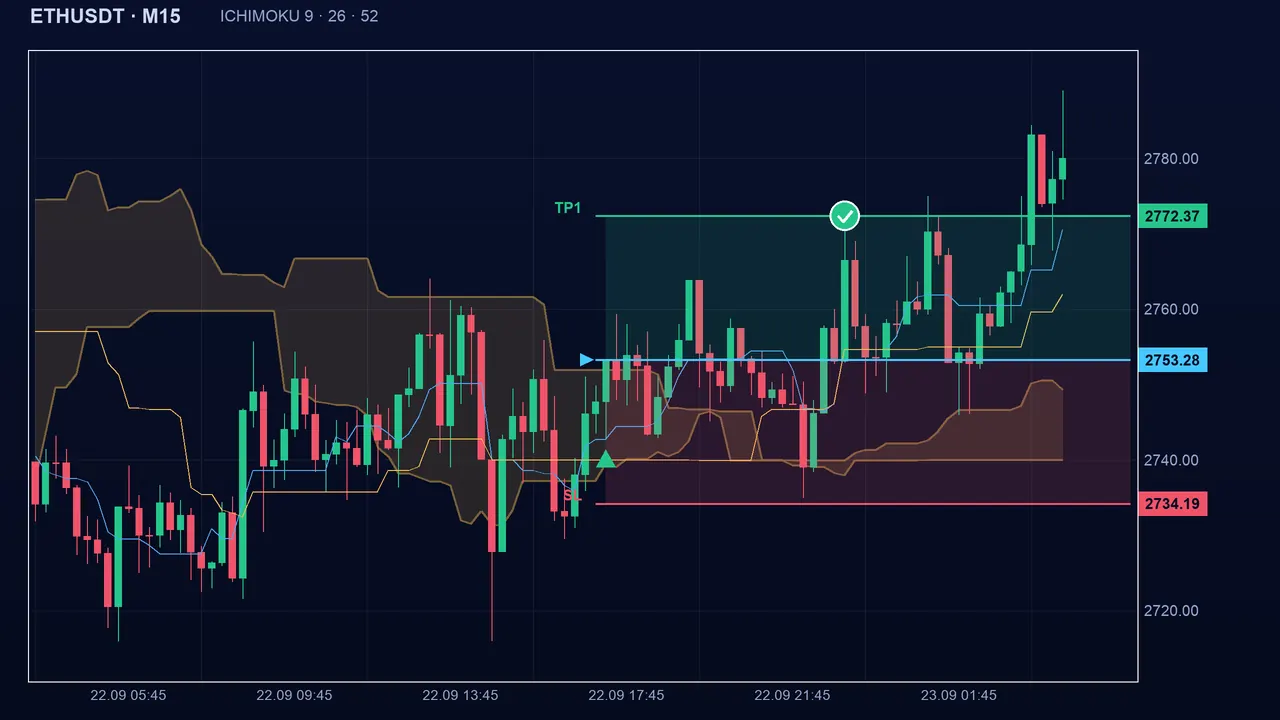
Buy: the close is above the top of the cloud AND Tenkan is above Kijun. Sell: the close is below the bottom of the cloud AND Tenkan is below Kijun. In every other case (price inside the cloud, or contradictory lines) the state is neutral. At least 78 candles of history are needed for the indicator to start. The signal appears when the state moves from neutral to bullish or bearish.
The settings
- Tenkan: 9 by default (1 to 100). Smaller: a jumpy line, earlier signals but more false ones.
- Kijun: 26 by default (2 to 200). It is also the forward shift of the cloud. Larger: a slower, steadier cloud.
- Senkou B: 52 by default (2 to 400). Larger: the far edge of the cloud moves less.
- The 9-26-52 values date from a time when people traded six days a week; nothing proves they are optimal on your markets. Change them little and test on a demo account.
The pitfalls
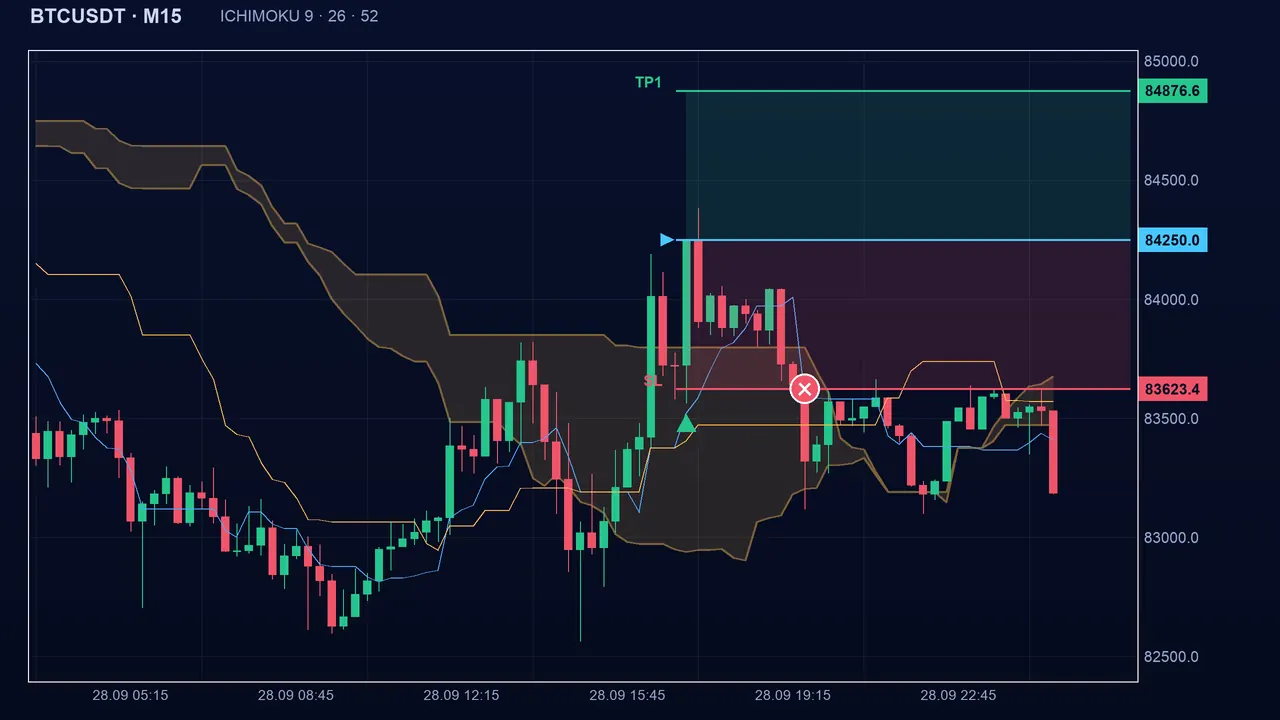
Ichimoku is a trend indicator: it likes moves that last. In a market that oscillates with no direction, price leaves the cloud, comes back, leaves again… and each exit can trigger a signal that reverses right away. Also, since price must already have left the cloud and Tenkan must already have passed Kijun, the signal often arrives after the move has begun. On Boom/Crash indices, a spike can also throw price out of the cloud in one go, before an equally fast return.
Key takeaways
- Ichimoku = cloud + Tenkan + Kijun. Buy if price is above the cloud and Tenkan above Kijun; sell in the opposite case.
- Price inside the cloud = neutral: the market is hesitating.
- It follows the trend with a delay and struggles in markets with no direction.
- Default settings: 9, 26, 52. The Chikou line is not used.
📝 Lesson test
Log in to take this lesson’s test. Once you have passed all the tests, you will receive a certificate in your name.
Log inThese lessons are for understanding and are not investment advice. No method guarantees winning.