
What is a Fair Value Gap for?
When price jumps, it sometimes skips an area where almost nothing traded. This “hole” is called a Fair Value Gap (FVG). Some traders think price tends to come back and fill it before moving on. It is a reading hypothesis, not a law: Algo Signals simply spots the hole on the candles and tracks whether it is still open.
How it is calculated
The gap is read on three consecutive candles. Let i be the current candle and i−2 the one two candles back. Wicks are compared, not bodies.
- Bullish FVG: the low of candle i is above the high of candle i−2. The zone runs from that high (bottom of the zone) to that low (top of the zone).
- Bearish FVG: the high of candle i is below the low of candle i−2. The zone runs from the high of i (bottom of the zone) to the low of i−2 (top of the zone).
- Size filter: the gap must be worth at least “minAtr × ATR” (0.3 × ATR(14) by default), to ignore micro-gaps.
- End of life: the zone is removed when a close goes to the other side (below the bottom of a bullish FVG, above the top of a bearish one: the hole is filled) or after 50 candles.
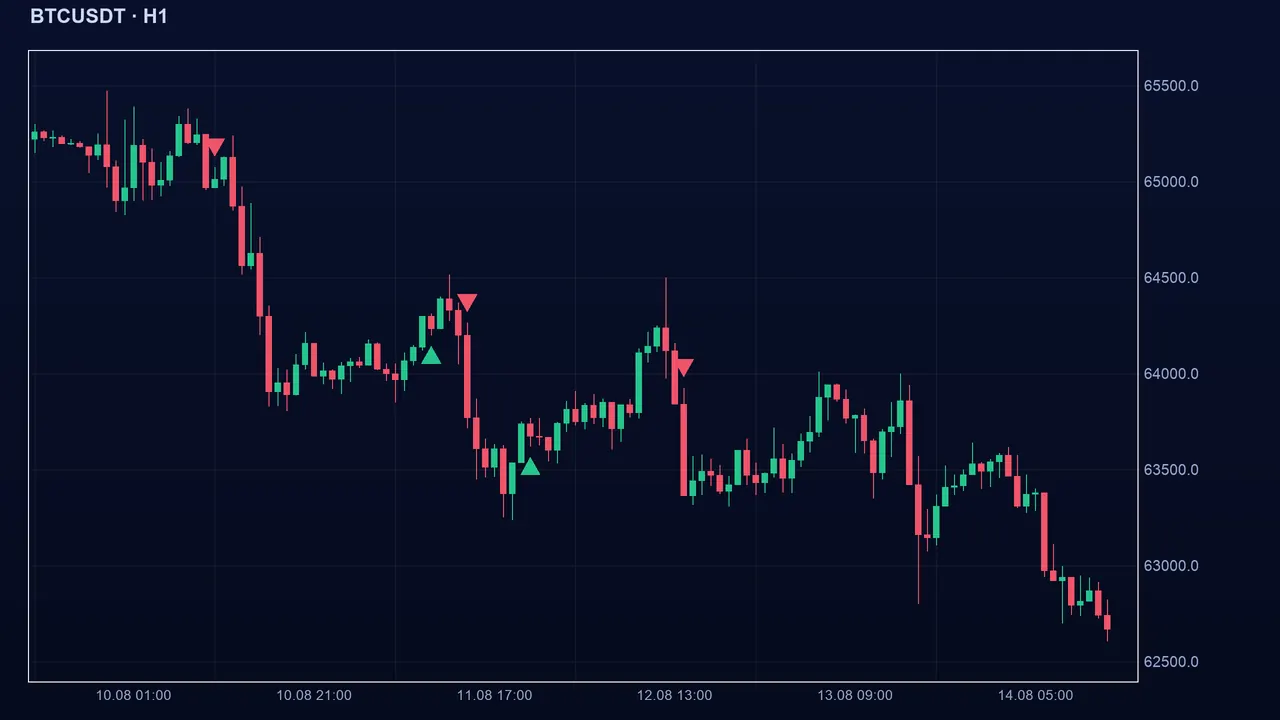
How to read the signal in Algo Signals
The state is the direction of the latest FVG that is still active: bullish or bearish, and neutral if there is none. It changes on the candle that creates a new gap, or when the active gap disappears (filled or too old). Note: what is measured is not the position of price but the existence of an open gap. A trader may also look for an entry on a return into the zone, but that reading is not part of the indicator.
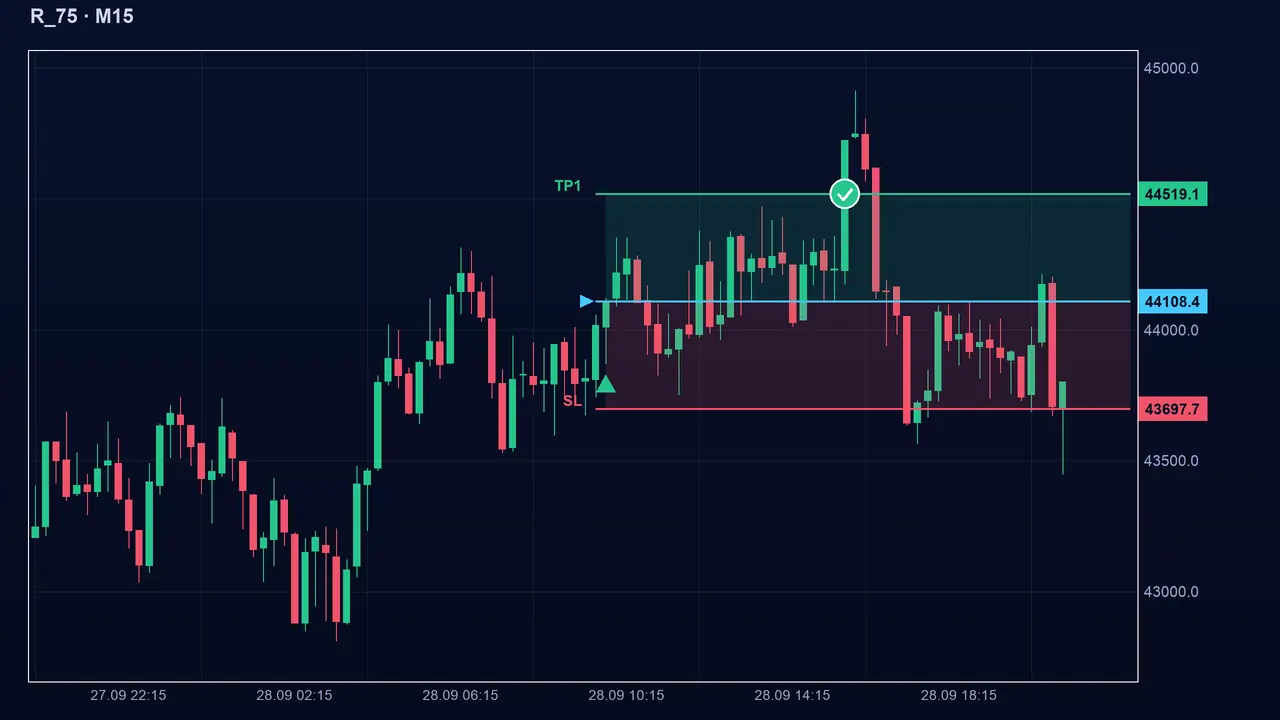
The settings
- Minimum size (minAtr, 0.3 by default, from 0 to 5): ATR multiple required. Larger, only big gaps; at 0, every gap counts.
- Lifetime (maxAge, 50 by default, from 3 to 500): number of candles a gap stays active if it is not filled.
- ATR period (atrPeriod, 14 by default, from 1 to 100): used to measure the size of the gap.
The pitfalls
A gap is not a guaranteed magnet: it can stay open for a very long time or be run through with no reaction. In a trend, gaps follow one another and each new signal arrives after the impulse candle. On markets that close (stocks, indices), the next day’s open creates gaps that do not look like an impulse. The calculation does not tell the difference.
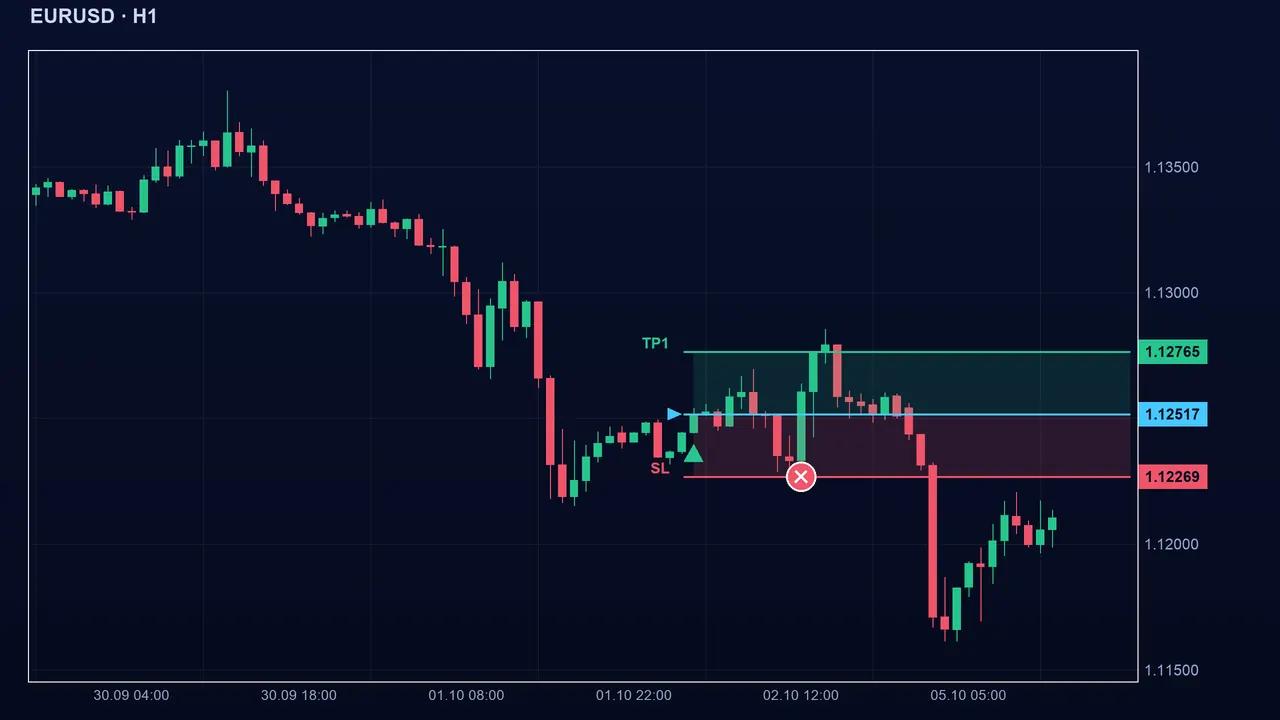
Key takeaways
- FVG = hole between the high of candle i−2 and the low of candle i (bullish), or the reverse (bearish); minimum size 0.3 × ATR.
- Filled by a close on the other side, or expired after 50 candles.
- The state shows the direction of the latest active gap, not the position of price nor a forecast.
- Combine it with a structure zone (order block, discount) and the trend, and keep a stop under the bottom of the zone.
📝 Lesson test
Log in to take this lesson’s test. Once you have passed all the tests, you will receive a certificate in your name.
Log inThese lessons are for understanding and are not investment advice. No method guarantees winning.