What it is for
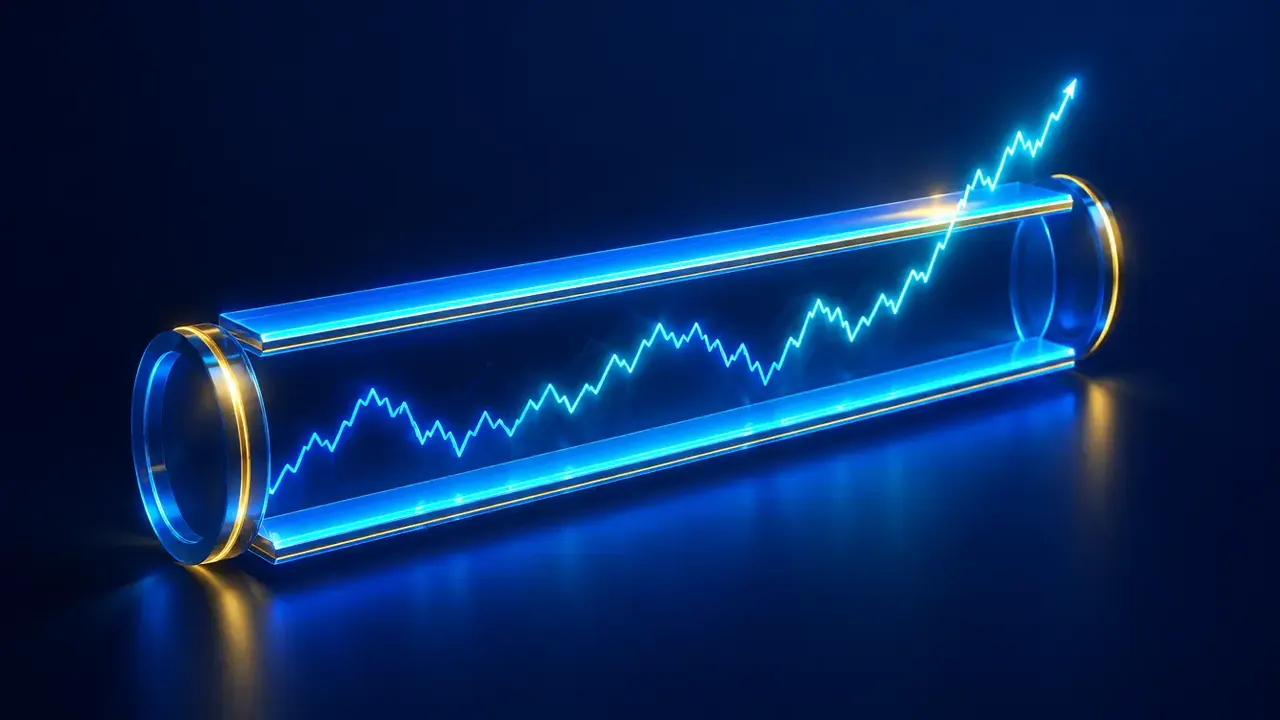
A quiet market always ends up leaving its usual zone. The Donchian channel asks a simple question: has price just gone beyond its recent high or low? This is the core idea of “breakout” methods, which have a long history in trend following. It helps spot the possible start of a move, not predict it: it says neither how far price will go nor whether the breakout will be real.
How it is calculated
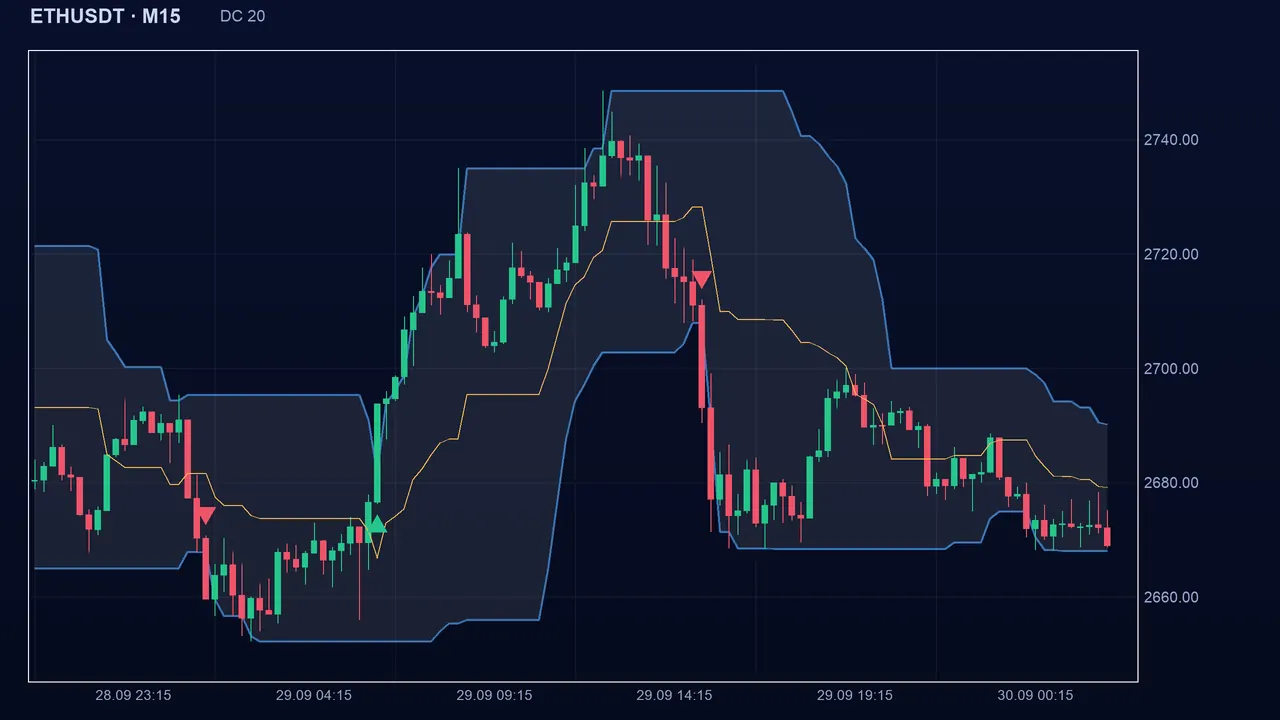
On every candle, Algo Signals looks at the previous 20 candles (the default). The highest of their highs forms the upper band, the lowest of their lows forms the lower band. The current candle is not counted: otherwise it could never exceed its own band.
It then compares the close, not the wick. A close above the upper band: bullish state. A close below the lower band: bearish state. Otherwise the previous state is kept until the opposite breakout.
Reading the signal in Algo Signals
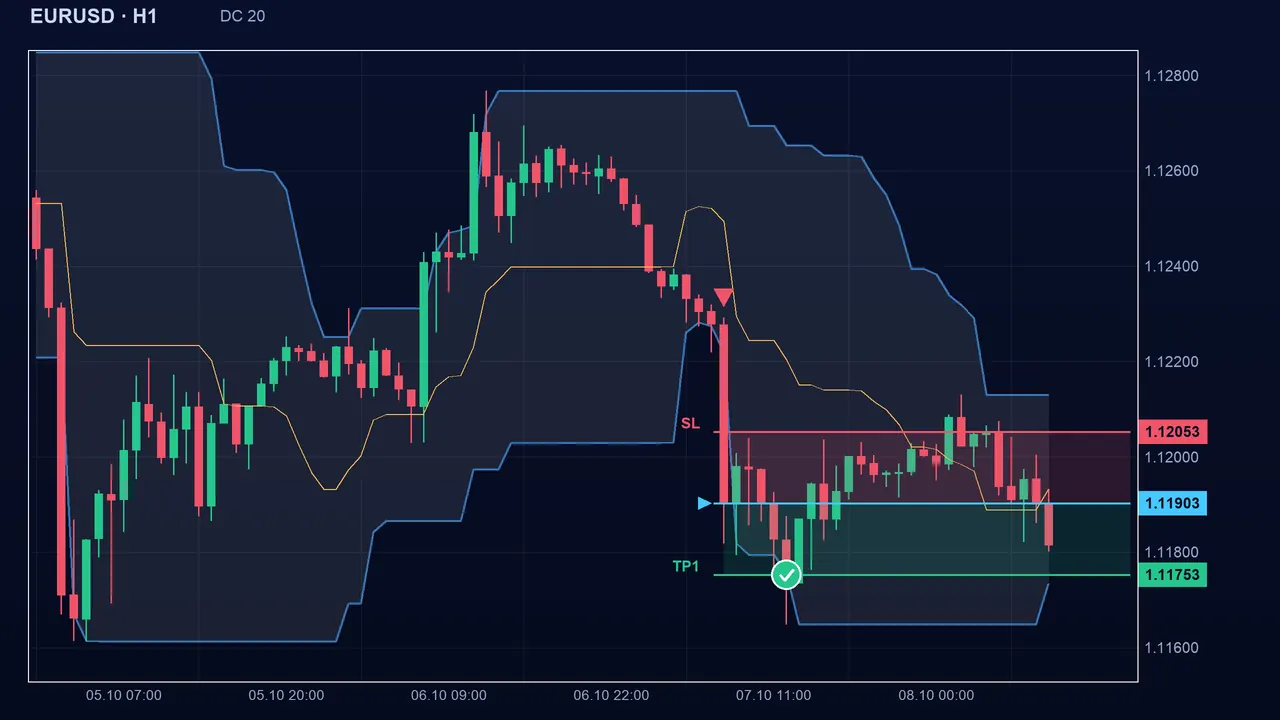
A buy signal appears when the state turns bullish: a candle closes above the highs of the previous 20. A sell signal appears when a candle closes below their lows. Because the state is kept, there is no new signal until the opposite breakout happens. The channel is a trigger: it gives an entry point.
The settings
- Period: 20 by default, adjustable from 2 to 300 candles. It is the only Donchian setting.
- Shorter (10, for example): the channel is narrow, breakouts are frequent, but many are just jolts.
- Longer (55, for example): the channel is wide, signals are rare and later; they match stronger moves.
- Choose the timeframe carefully too: it changes the result as much as the period does.
The pitfalls
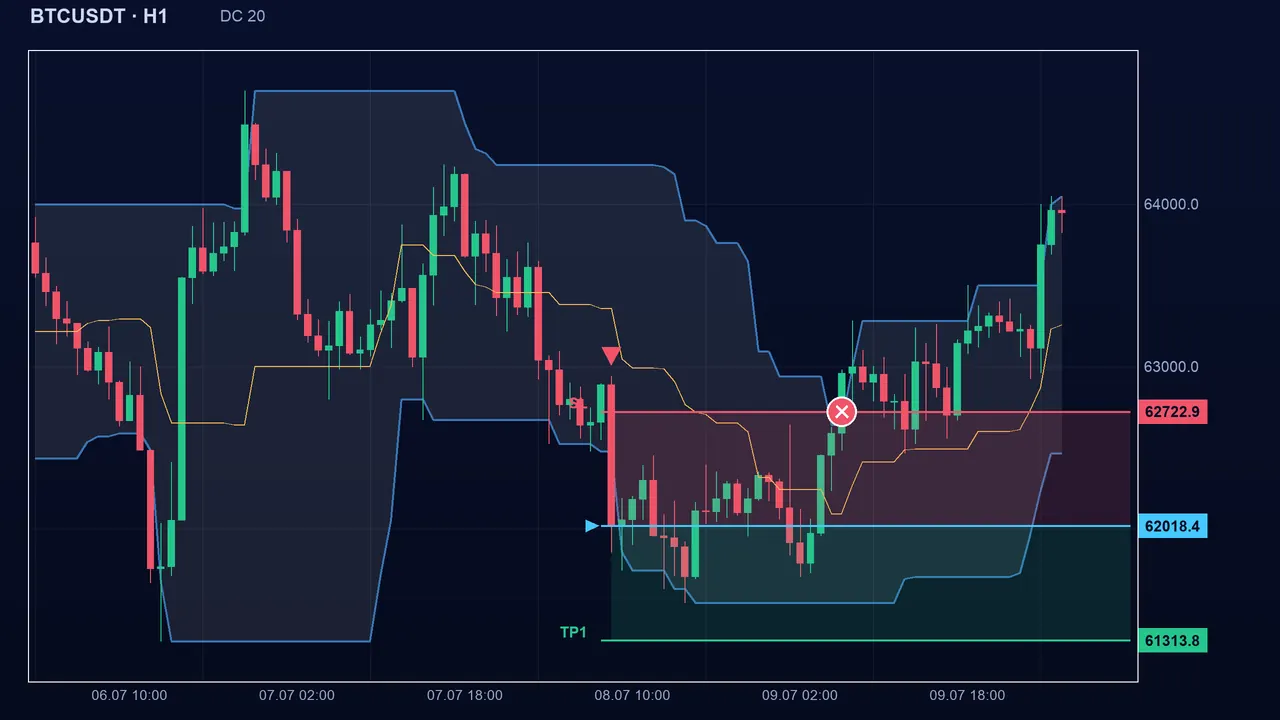
In a market with no direction, price pokes through the band, turns back and returns inside the channel: a false breakout. Also, the bullish state is kept until a close below the lower band, so the opposite signal comes late, sometimes after a large floating loss.
Key takeaways
- Donchian compares the close with the highest high and lowest low of the previous 20 candles (default setting).
- It flags a breakout, not a certainty: many breakouts fail, especially without a trend.
- The state is kept: the opposite signal comes late, hence the importance of a stop-loss.
- In confluence: combine it with a trend filter (MA 200, ADX) to set aside some of the false breakouts.
📝 Lesson test
Log in to take this lesson’s test. Once you have passed all the tests, you will receive a certificate in your name.
Log inThese lessons are for understanding and are not investment advice. No method guarantees winning.