What is the Didi Index for?
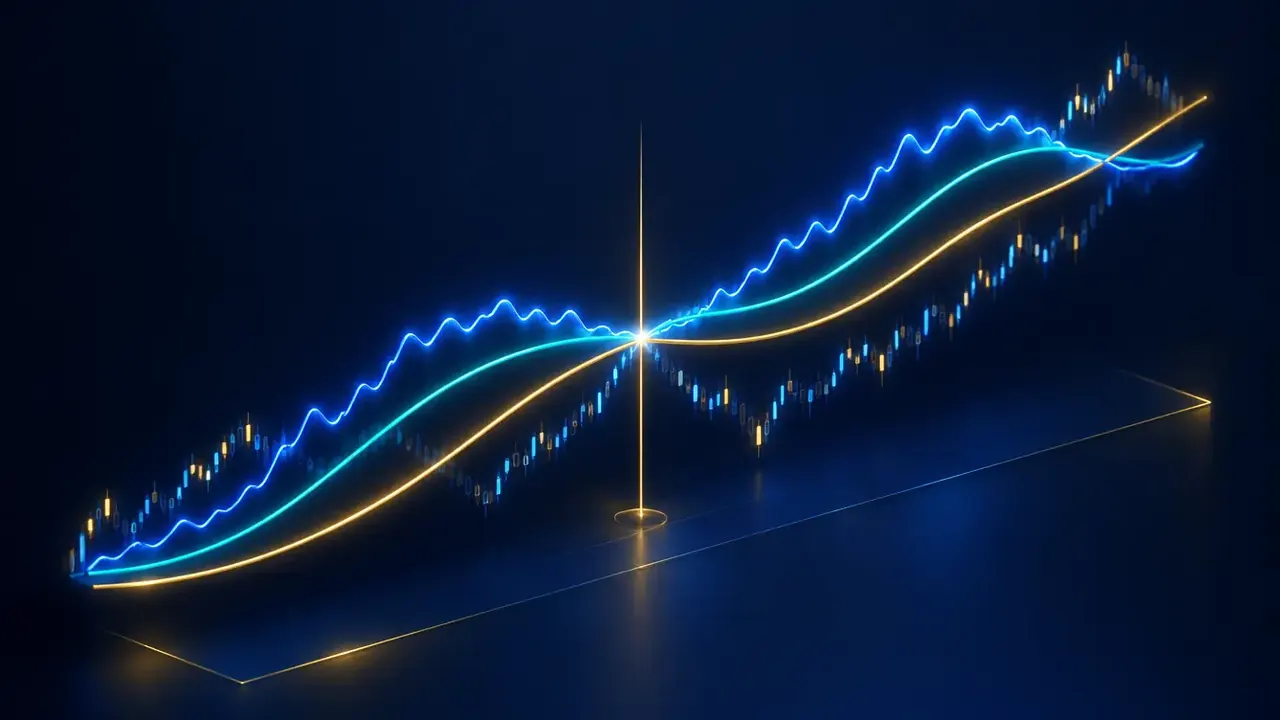
The Didi Index was born in the Brazilian trading community (created by Didi Aguiar). It uses three simple moving averages of the close, a short, a medium and a long one, and compares the short and the long ones to the middle average, which serves as a reference line. The aim: spot the moment when the fast average crosses the slow one while the middle average has already taken a position, a sign that a move is taking shape.
How it is calculated
- Three simple averages of the close: short (3 candles), medium (8) and long (20).
- “Short” curve = average 3 ÷ average 8. “Long” curve = average 20 ÷ average 8. Average 8 is the reference and therefore equals 1; the other two curves oscillate around 1.
- Long curve below 1: average 20 is below average 8, a rather bullish setup. Long curve above 1: average 20 is above average 8, a rather bearish setup.
- Nothing is computed with the future, so the signal does not repaint. It needs 20 candles to start. Since both curves share the same denominator, the short curve crosses the long one exactly when average 3 crosses average 20.
Reading the signal in Algo Signals
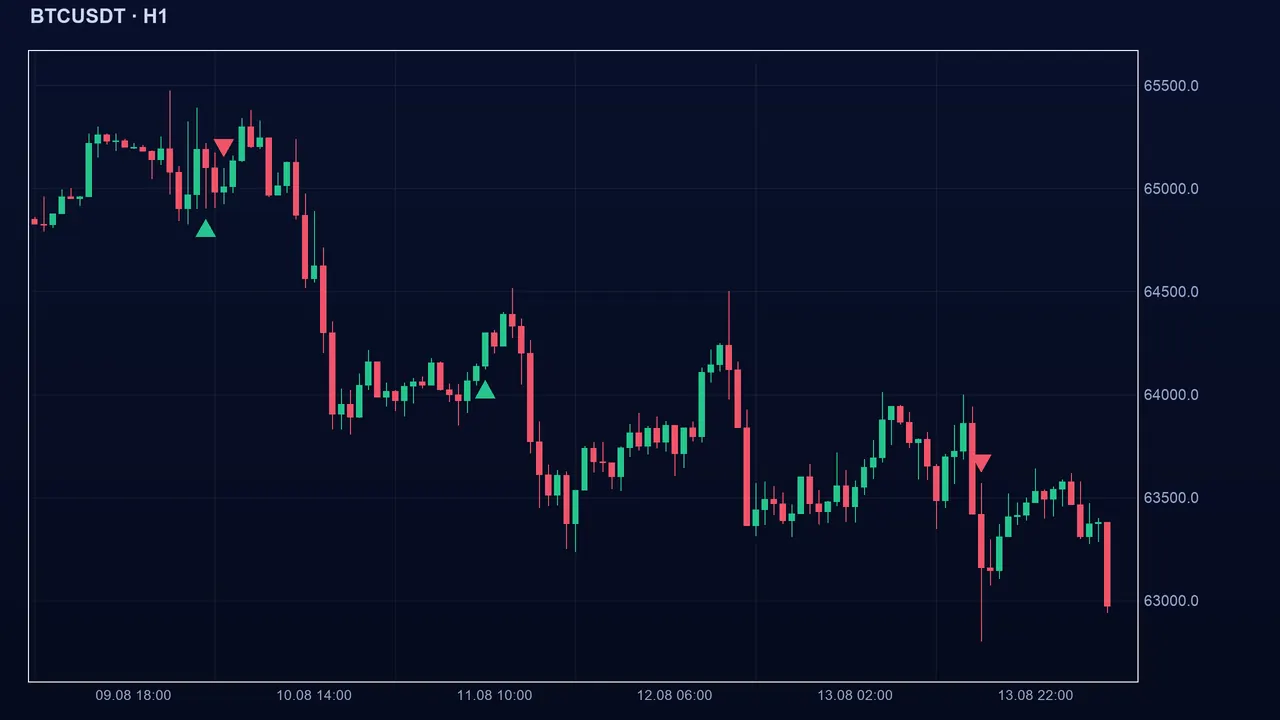
Buy: the short curve moves above the long curve, and the long curve is below 1. Sell: the short curve moves below the long curve, and the long curve is above 1. The signal lasts only one candle, the crossover candle; the rest of the time the state is neutral. In practice, a buy requires average 3 to go above average 20 while average 8 is already above average 20.
The settings
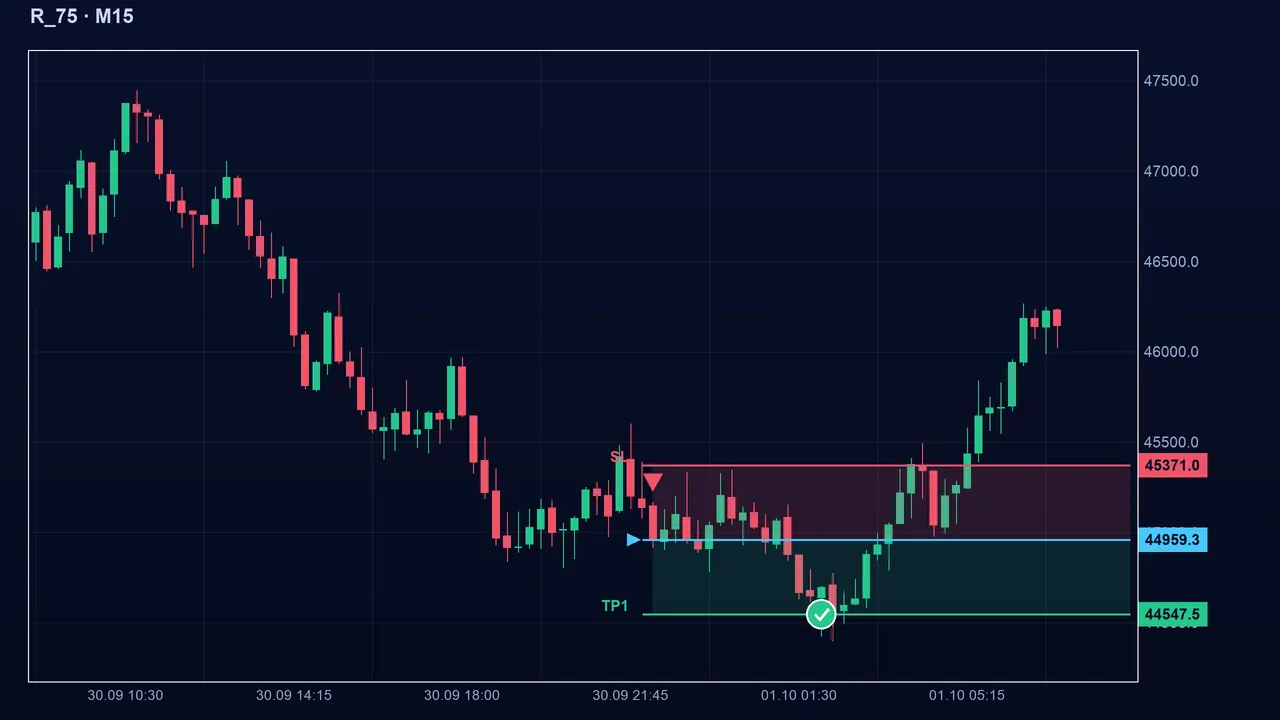
- Short: 3 by default (1 to 50). Smaller: the curve hugs price, with more crossovers and noise.
- Medium: 8 by default (2 to 100). It is the reference line (the divisor): it defines what “above 1” means.
- Long: 20 by default (3 to 300). Larger: a slower underlying trend, rarer and later signals.
- These are the index’s traditional values; nothing proves they are optimal for your market.
The pitfalls
The signal is a one-candle event: if you miss it, there is no “buyer” state to consult afterwards. There is also no guaranteed symmetrical exit signal: a reverse crossover produces a sell only if the long curve is then above 1; otherwise nothing appears. Finally, in a market with no direction, the three averages tangle and cross constantly. On Boom/Crash, a spike shifts average 3 at once and causes a crossover that vanishes a few candles later.
Key takeaways
- Didi compares averages 3 and 20 to average 8; the signal exists only on the crossover candle.
- Buy: short above long and long below 1. Sell: the opposite, with the long curve above 1.
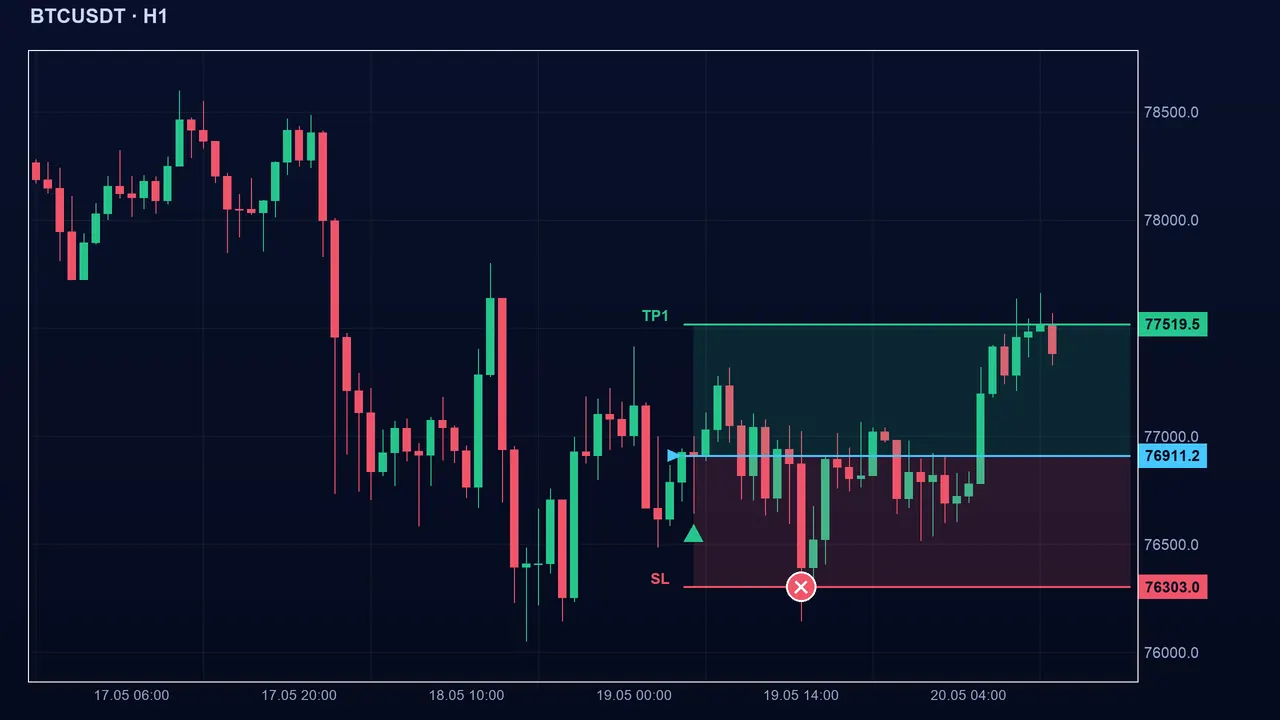
- A reverse crossover without the right position relative to 1 gives no signal: always plan a stop.
- Default settings: 3, 8 and 20.
📝 Lesson test
Log in to take this lesson’s test. Once you have passed all the tests, you will receive a certificate in your name.
Log inThese lessons are for understanding and are not investment advice. No method guarantees winning.