
A price drifts away from its average, comes back, then drifts away again. The CCI (Commodity Channel Index) measures how far the price has moved from its recent average, taking the market’s usual agitation into account. A CCI of +100 means “clearly above the average for this market”. It is a measure of distance, not a forecast.
How it is calculated
For each candle, Algo Signals computes the typical price TP = (high + low + close) ÷ 3. It takes its simple average over 20 candles, then the mean deviation: the average of the absolute gaps between each TP and that average. Finally CCI = (TP − average) ÷ (0.015 × mean deviation). The constant 0.015 comes from the original formula.
- Reading example: TP 12 above the average, mean deviation of 8 → CCI = 12 ÷ (0.015 × 8) = 100.
- A positive CCI: the typical price is above its average. Negative: below.
- Since we divide by the usual agitation, +100 means the same thing in a calm market and a nervous one.
Reading the signal in Algo Signals
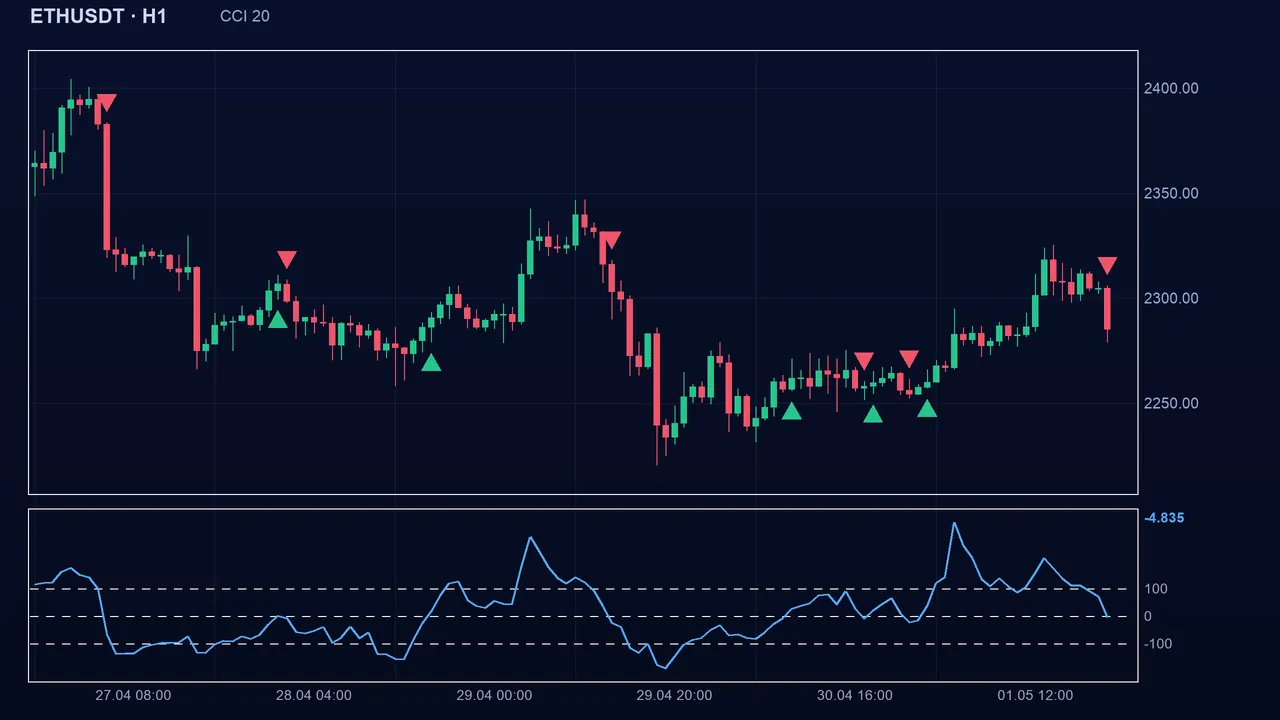
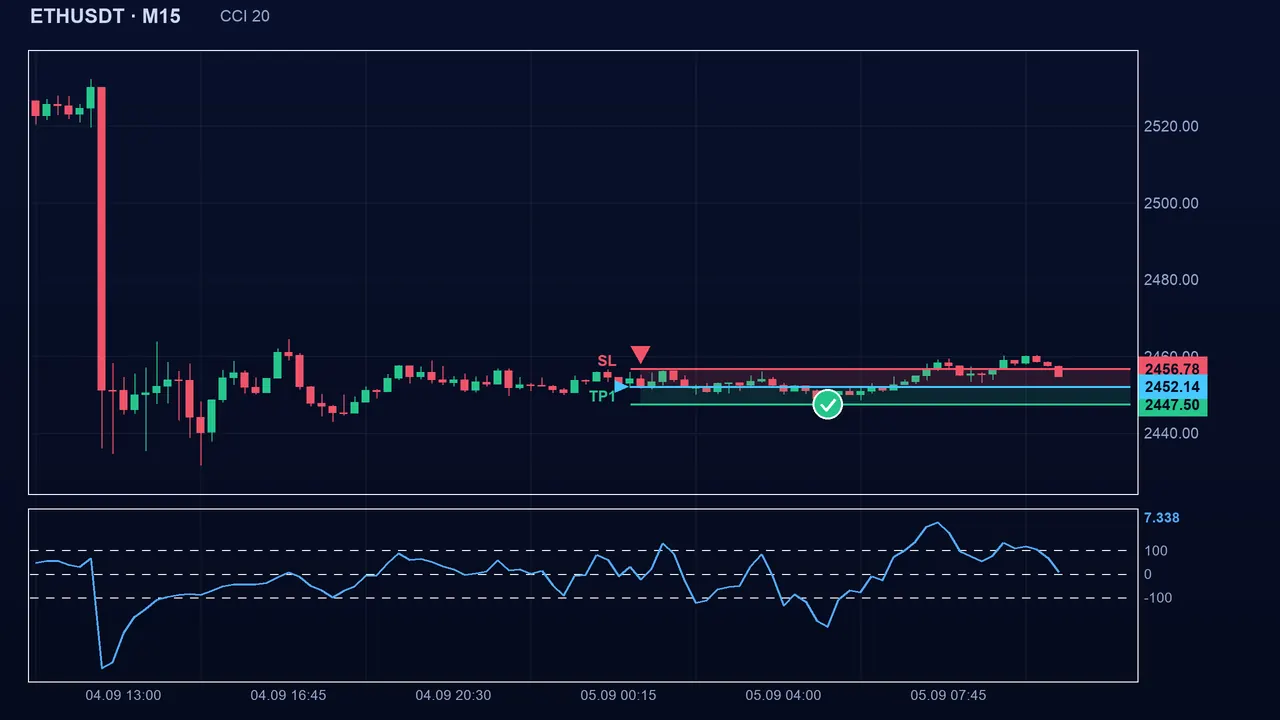
The “Signal” setting (sigMode) has two modes. Mode 1 (default): bias. Bullish if the CCI is positive, bearish if negative; the signal appears when it crosses zero. Mode 2: return from the extremes. Buy when the CCI comes back above −100 (it leaves the low zone), sell when it falls back below +100 (it leaves the high zone); the state is kept until the opposite event.
The settings
- Period (period): 20 by default (2 to 200). Shorter, the CCI is jumpy and often reaches ±100; longer, it is calmer.
- Signal (sigMode): 1 = sign around zero (default), 2 = return from ±100.
- Level (cciLvl): 100 by default (20 to 300). It only serves mode 2. Larger, fewer but more extreme signals; smaller, more.
- These values are conventions: do not tune them to “fit” the past.
The pitfalls
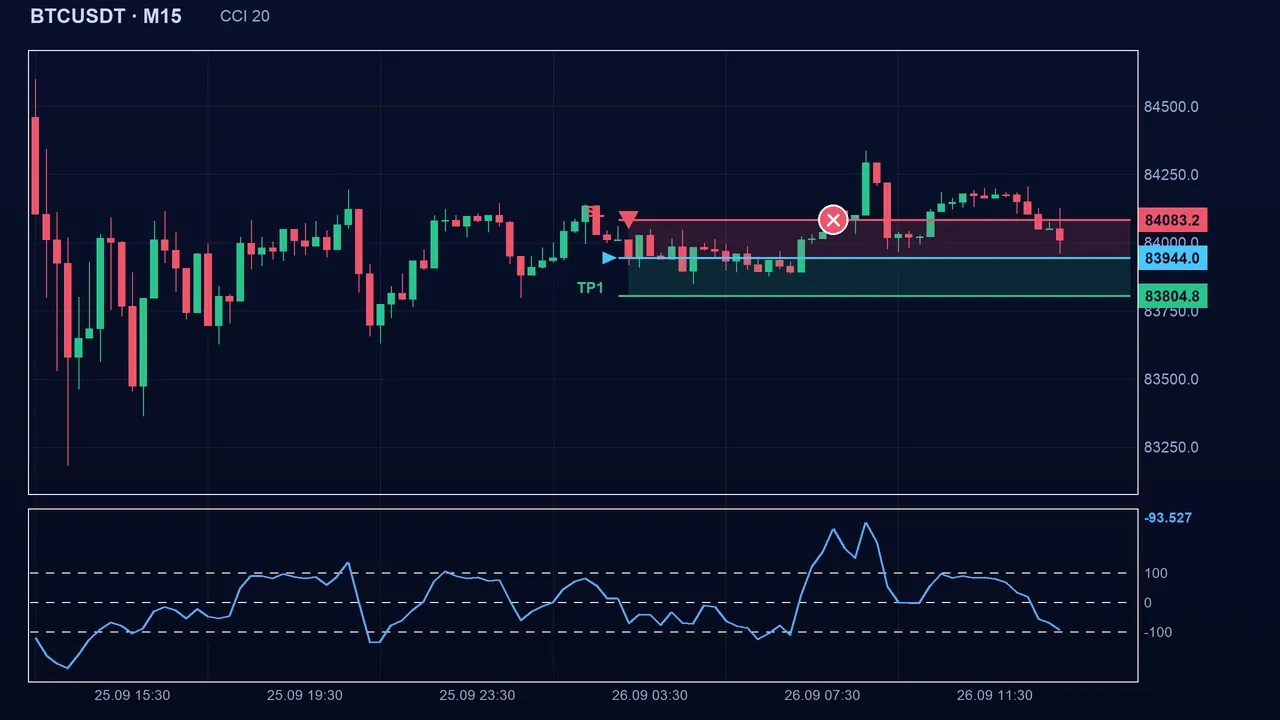
The CCI is not bounded: it can exceed +200 or −200 in a strong trend. Being above +100 is not a sell signal: in a trend the CCI can stay there for a long time, and a sell on leaving the high zone is often premature. In mode 1, a flat market makes the CCI oscillate around zero and multiplies small signals. On spike indices (Boom/Crash), a sudden spike distorts the average and the mean deviation for several candles.
Key takeaways
- CCI = (typical price − average) ÷ (0.015 × mean deviation), over 20 candles by default.
- Mode 1: positive = bullish, negative = bearish. Mode 2: buy on the return above −100, sell on the return below +100.
- It is not bounded: large values signal a strong trend as much as an excess.
- Combine it with a trend filter (ADX, MA 200) or another oscillator to require several confirmations.
📝 Lesson test
Log in to take this lesson’s test. Once you have passed all the tests, you will receive a certificate in your name.
Log inThese lessons are for understanding and are not investment advice. No method guarantees winning.