
A price does not move away from its average forever, but how far is “normal”? Bollinger Bands answer by measuring the market’s recent agitation. When price touches the outside of the band, it is further from its average than usual. Algo Signals turns this into a mean-reversion signal.
How they are calculated
Three lines, over the last 20 closes. The centre line is the simple average of those 20 closes. The standard deviation measures how dispersed the closes are around that average: square each close’s gap to the average, average those squares, then take the square root. The upper band is average + 2 standard deviations, the lower band average − 2 standard deviations.
- Default values: period 20 (period) and 2 standard deviations (dev).
- When the market gets agitated, the standard deviation grows and the bands move apart. When it calms down, they tighten.
- The bands do not say where price will go: they only say whether it is far from its recent average, given its agitation.
Reading the signal in Algo Signals
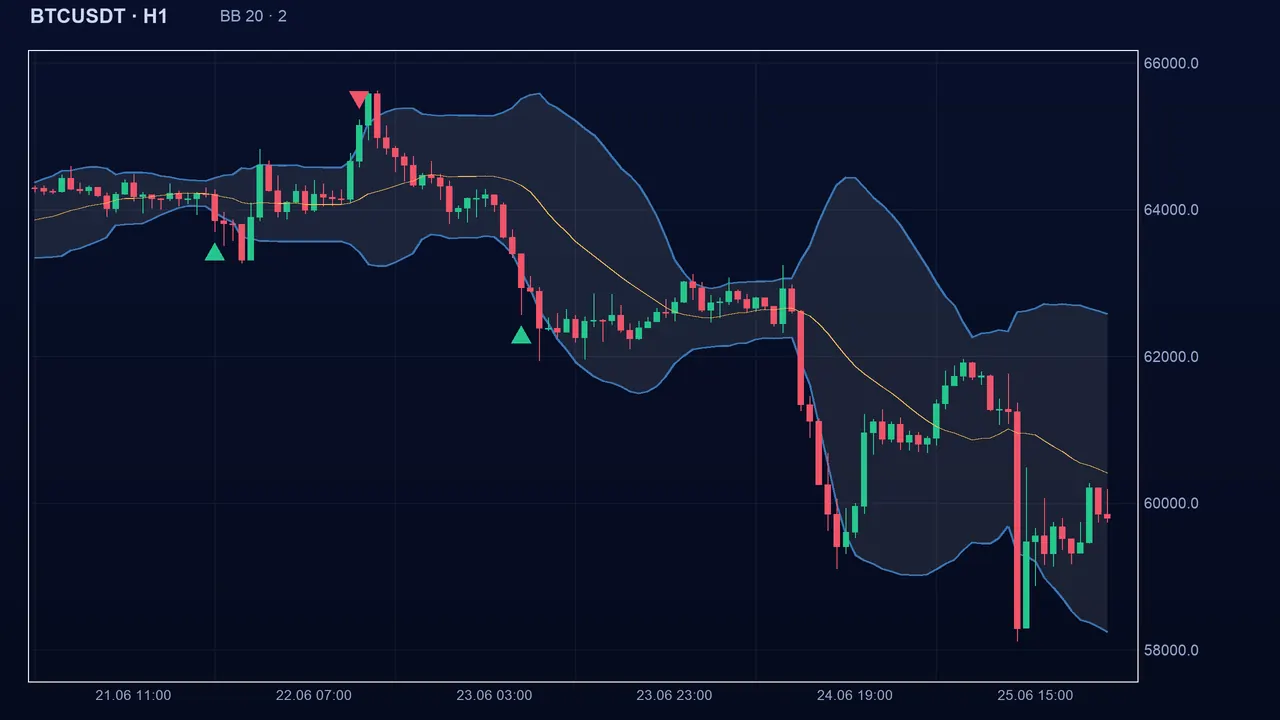
A buy state appears when the close is on or below the lower band. A sell state appears when the close is on or above the upper band. Between the two bands, the state is neutral. It is mean-reversion logic: the bet is that a price that has moved too far will return towards its average. Stop and target methods can also use the bands.
The settings
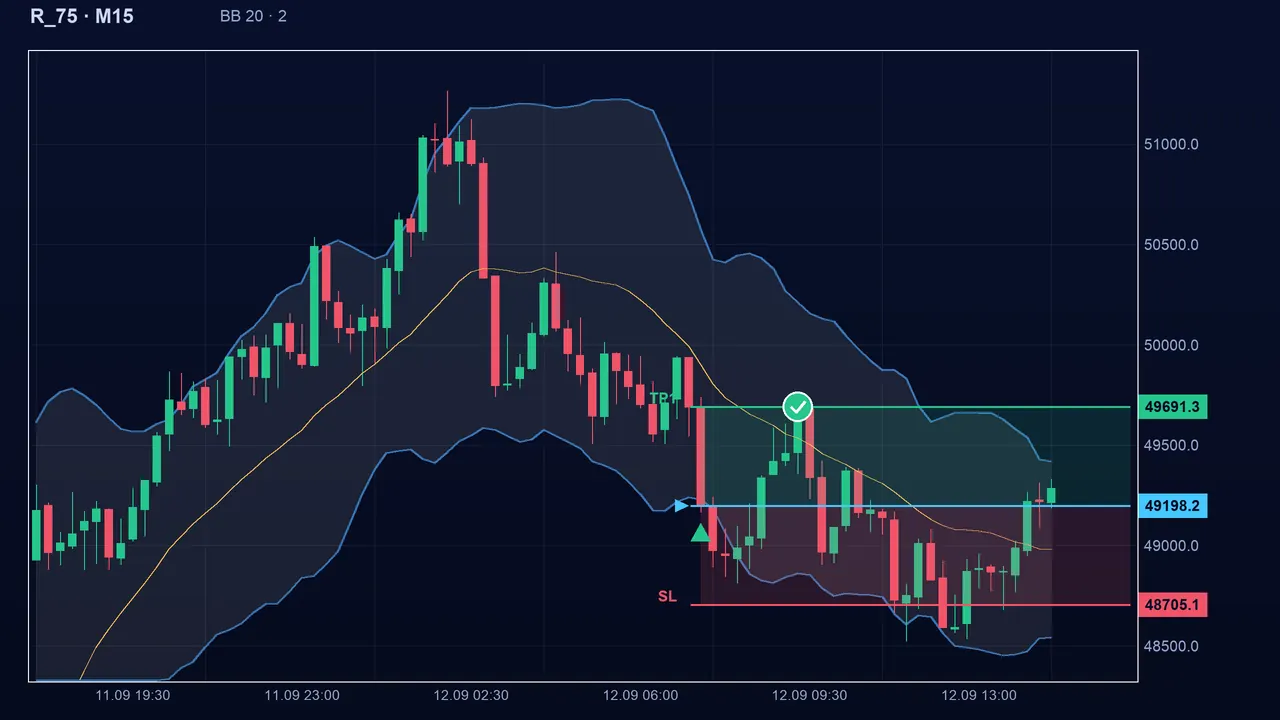
- Period (period, 20): shorter, the bands follow price closely and are touched more often; longer, they are steadier.
- Standard deviations (dev, 2): at 3, the bands are wider, signals rarer but more extreme; at 1, they become very frequent.
- The setting uses the same values on every market, but each market’s agitation changes the real width of the bands.
The pitfalls
Key takeaways
- Bollinger Bands = 20-period simple average ± 2 standard deviations.
- Buy: close on or below the lower band. Sell: on or above the upper band.
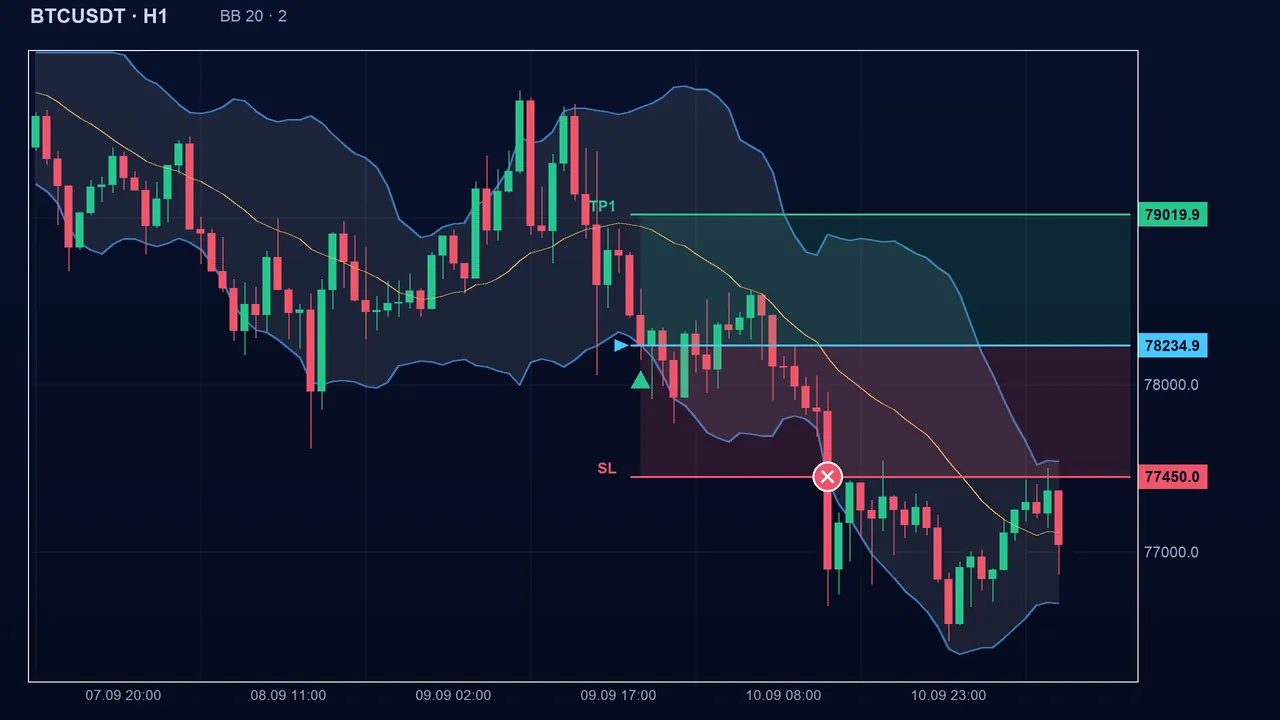
- Mean-reversion logic: it fails in strong trends.
- Define the stop before entering and count your results in R.
📝 Lesson test
Log in to take this lesson’s test. Once you have passed all the tests, you will receive a certificate in your name.
Log inThese lessons are for understanding and are not investment advice. No method guarantees winning.